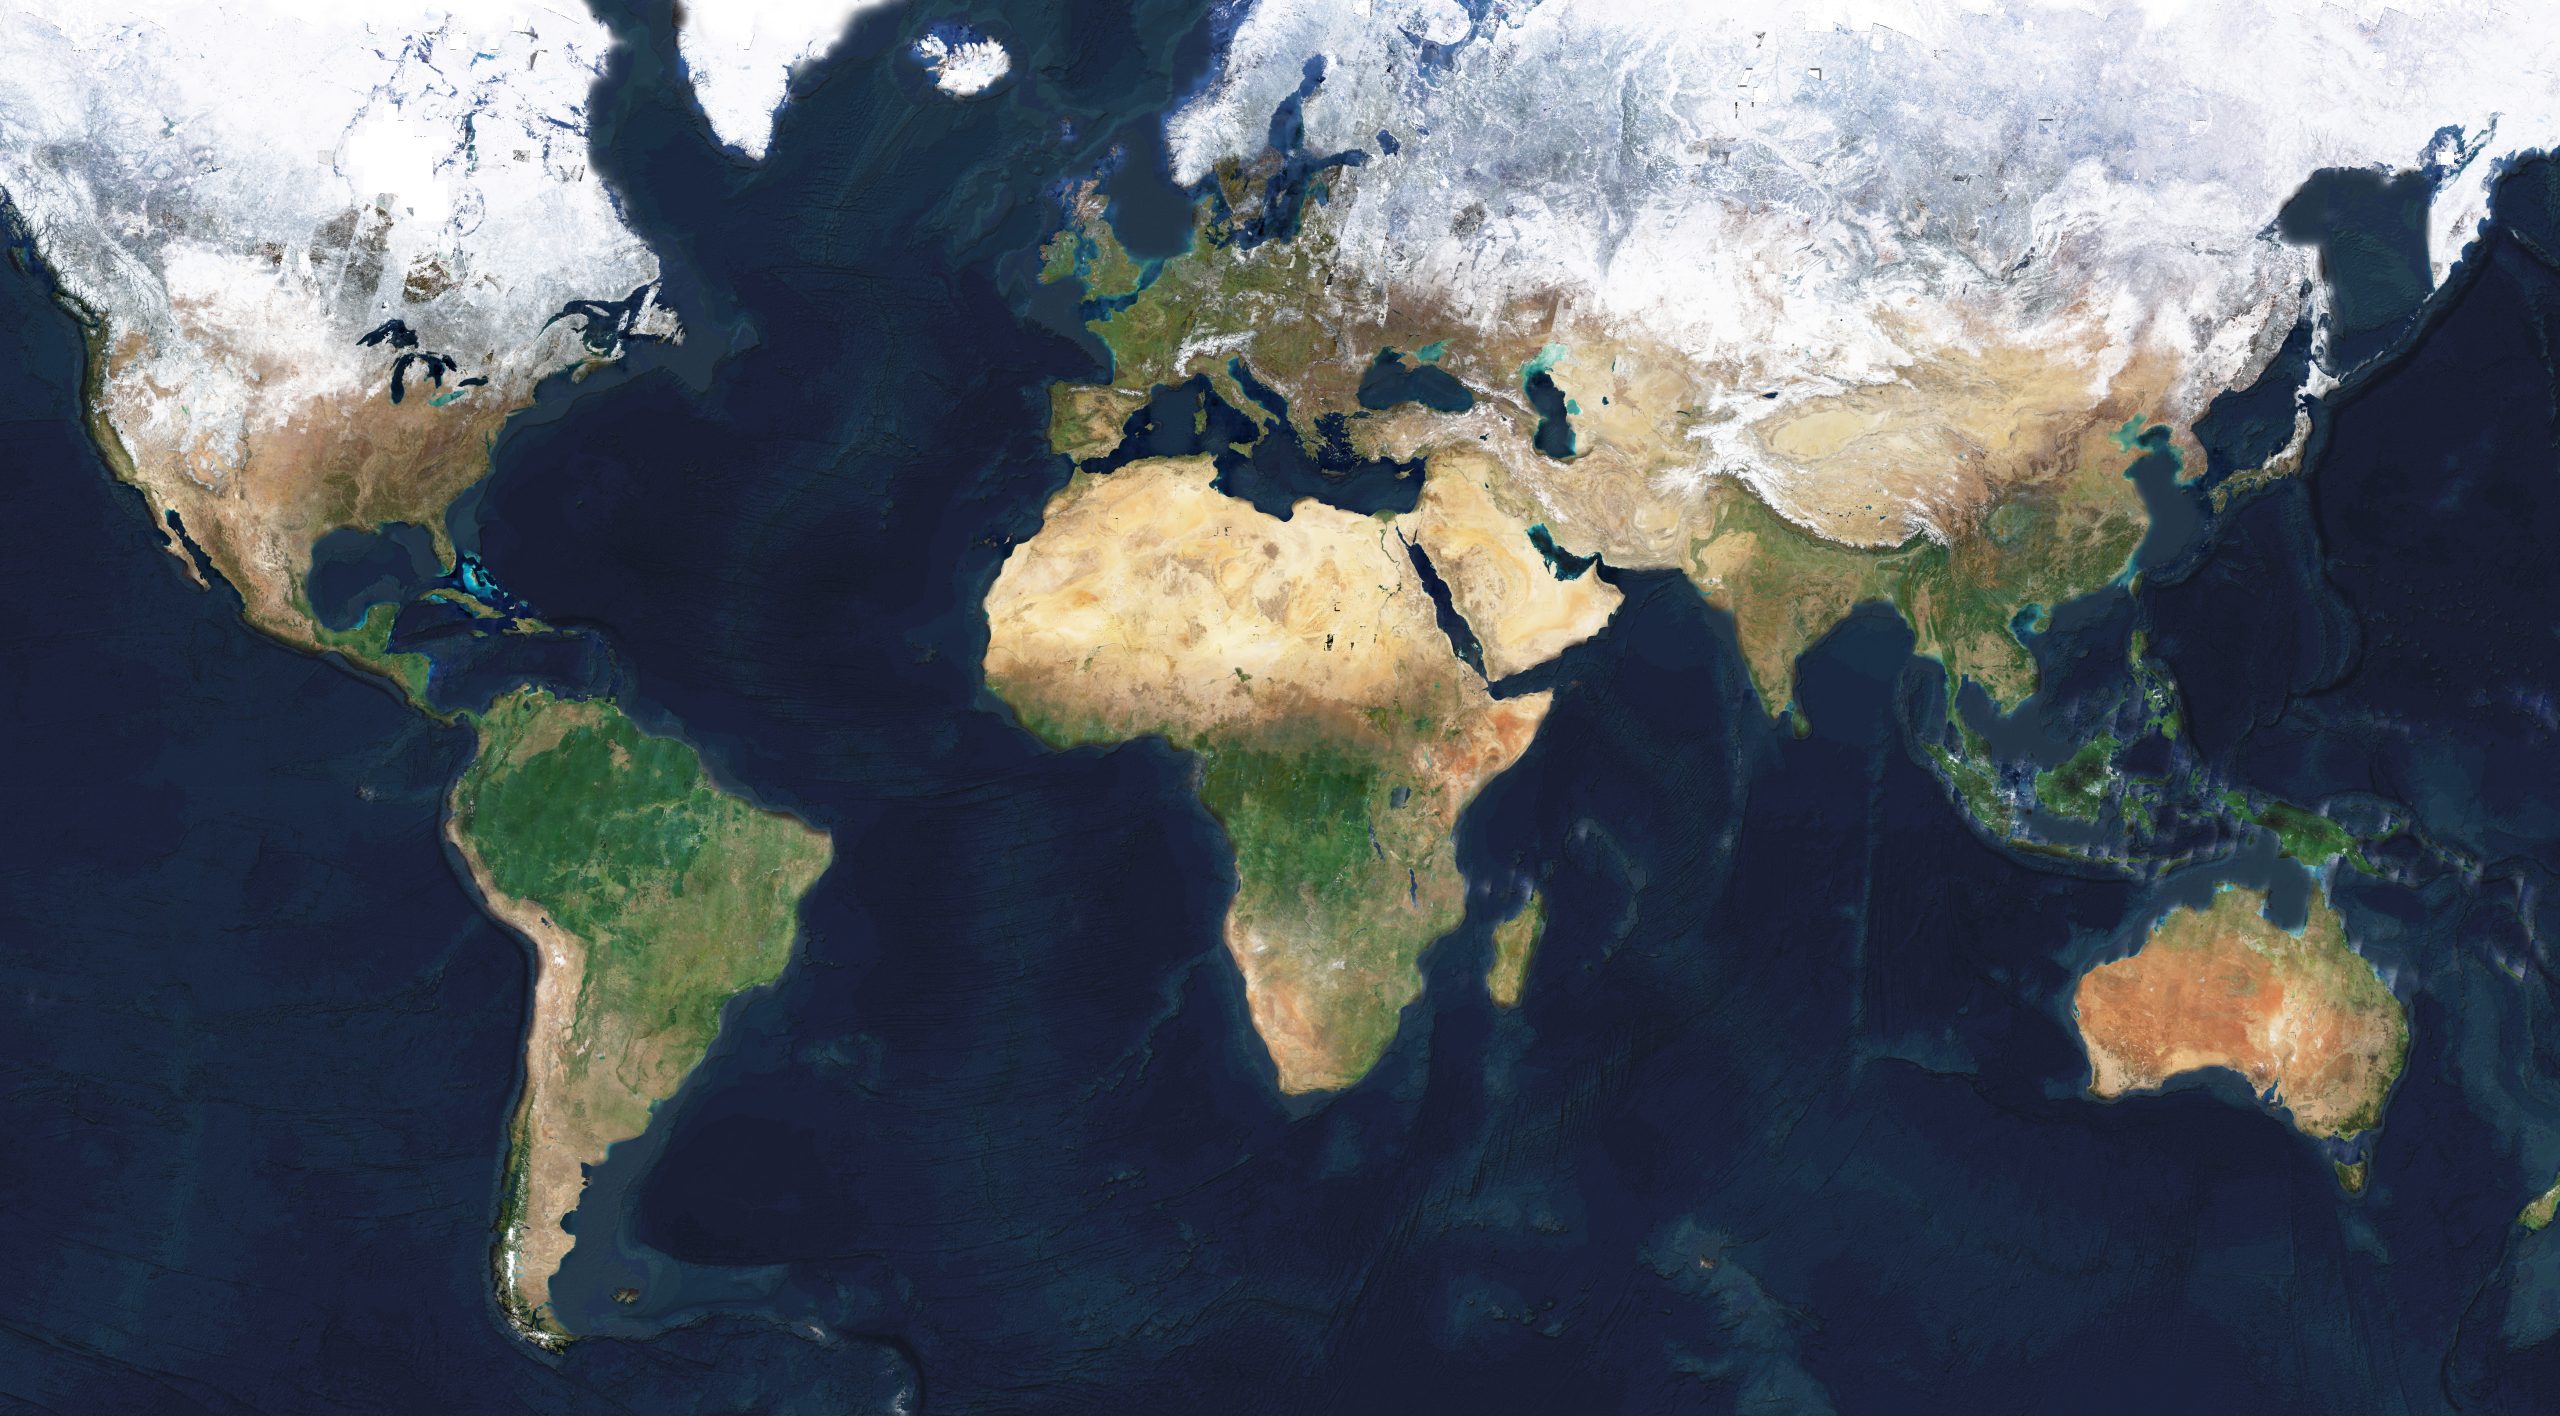
The idea behind Nimbo’s satellite basemaps is to provide a way to explore satellite imagery in a clear, dynamic and user-friendly fashion. We have thus created monthly mosaics of satellite images covering the world’s whole landmass, depicting the dominant lay of the land during the period considered. What makes them unique is that they are cloud-free, seamless, homogenous, and updated every month. Here’s all you need to know about Nimbo’s online satellite maps.
What makes Nimbo’s satellite basemaps different ?
In times of huge environmental and climate challenges, space imagery has a wealth of information in store to help us better comprehend and tackle these pressing issues. The only thing is, raw satellite views are no easy material to collect, manipulate and analyze.
The promise of satellite imagery is to deliver data that is at once global, temporally continuous and homogenous. But in practice, things turn out to be a lot more complicated. Satellite images are like the tiles of a puzzle, and putting them together to get a clear picture requires a lot of expertise. There is information discontinuity – or even total loss – caused by clouds. There also can be differences in data specifications preventing any attempt at directly comparing them together.
Hence the crazy idea: bringing out a solution letting everyone access and browse satellite mosaics of the world that are readymade, regularly updated, unobstructed by cloud cover and based on the same set of specs anywhere in the world. Just as in your regular map application, but easy to comprehend and manipulate.
And updated every month so as to get a clear view of our planet as it changes: shortly before mid-month, the prior month’s Earth map is released on Nimbo.
What kind of Earth maps do I get on Nimbo ?
Earth Online provides synthetic satellite basemaps of Sentinel 1 and 2 images from the Copernicus programme, at 10-meter resolution. We have developed a unique solution that processes the entirety of Sentinel-2 and Sentinel-1 acquisitions, so as to provide the best photography of the world for a given month.
This implies many challenges in terms of delivery time, cloud removal and color treatment uniformity, as we will see later on.
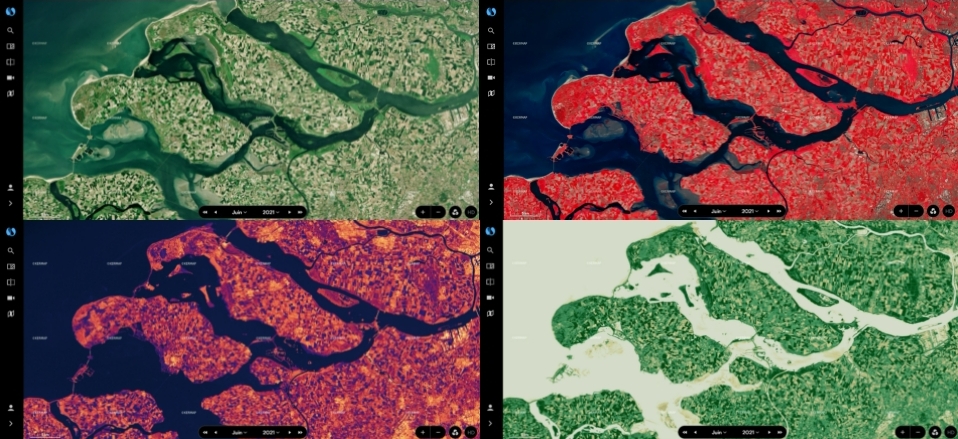
And since satellite constellations capture our planet’s surface in various modes, why limit ourselves to a single view in natural colors ? There is precious data to gather also from other view types. That is why we decided to produce five layers :
- Natural Colors
- Infrared imagery
- NDVI, for Normalized difference vegetation index
- LAI, for Leaf Area Index
- Radar
All of them are available for free in Nimbo, except LAI, which can be obtained on demand by contacting our sales department.
How did we get rid of clouds ?
Clouds have been cleaned out from these images thanks to our exclusive AI process, which operates non-stop at global level. How do we brush them away exactly ? By looking up for the closest unclouded image of the same area, temporally speaking. This is done at pixel level, so that the cloud cover can be comprehensively eliminated, while delivering the most true-to-reality image.
The images served on Earth Online (web platform) and Earth Basemaps are based on Sentinel images acquired throughout each month. All portions without clouds or cloud shadow are merged, with a priority given to images closest to the middle of the month, so as to obtain a representative visualization of said month. If an area was clouded during each Sentinel revisit during the month, then the model will seek the next closest unclouded acquisition of this area during the two prior and posterior months.
So what’s the date of the basemap I’m looking at ?
Our basemaps therefore carry out a kind of weighted interpolation of all the cloud-free data available in the month to model the image of the 15th of the month. This process allows us to ensure perfect traceability of the data produced. Each pixel carries information about its average date, so that the contribution of real observations and their deviation from the 15th of the given month is known.
This means that satellite mosaics you will find on Nimbo come down to representing the dominant lay of the land during the month considered. They will allow you to observe lasting changes from one month to another, or one year to another, like drought impact on vegetation and crops, or definitive land transformations for instance. But some changes may be overlooked if they are too ephemeral.
That will be the case with minor floodings, or short snow episodes. Those will not appear in a monthly synthesis as they do not reflect what the area looked like dominantly during the 30-day period. Of course, if an area is covered by snow throughout a given month, or during most part of it, that will be the information retained on the map.
How do we color our satellite basemaps ?
The aim with Nimbo’s monthly views is to produce data that is the most homogenous possible to facilitate image processing up to a continental or global scale.
It was therefore crucial to create a product that would be homogenous from one pixel to another, whether in northern Europe or in the equatorial zone.
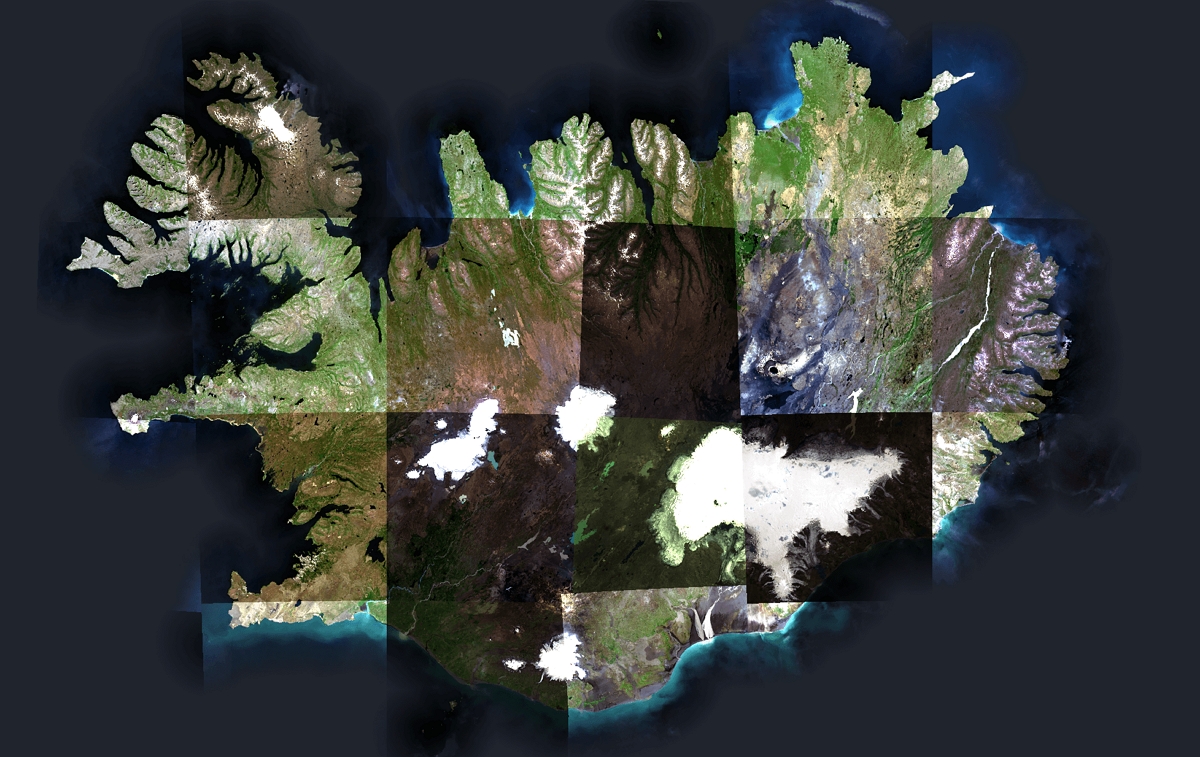
The colors of Sentinel-2 images are acquired in 16-bit format and in a wide spectrum of values. It is therefore very difficult to homogeneously represent this entire spectrum of values in an 8-bit spectrum usually used by all of our daily screens (computers, televisions, smartphones). The result is that it is thus very complicated to represent objects with low and high reflectance simultaneously. For example, an image containing snow and water will have difficulty representing the low values which represent water and the high values which represent snow, as in the picture. Here’s an example on Iceland, and what the outcome would be with standard normalisation processes (left) vs the final result after our in-house color harmonization method (right):
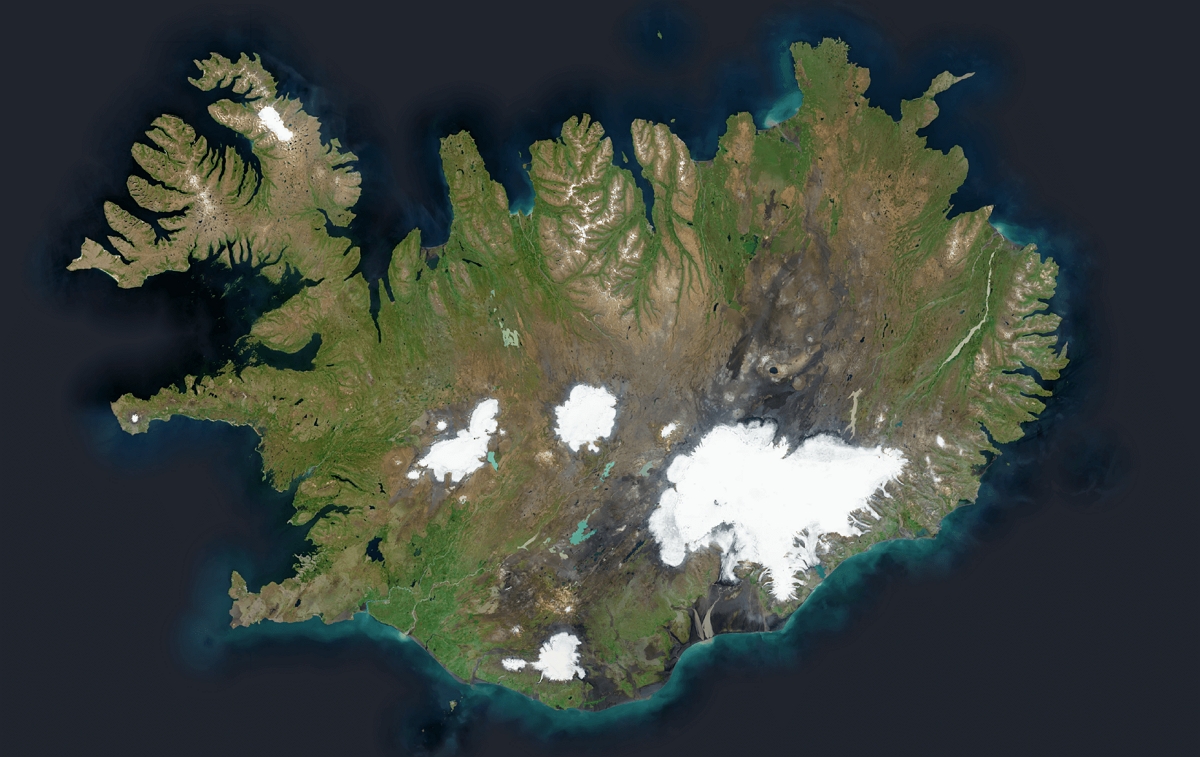
To allow a more pleasant simultaneous visualization of these very different landscapes, it is necessary to use very specific nonlinear colorization methods. This is what we have developed to produce monthly 8-bit Nimbo basemaps with vibrant and consistent images across the entire globe and in all types of landscape contexts.
What is the format of Nimbo’s Earth Basemaps ?
The data provided by Nimbo is currently available in 8-bit using a TMS (Tile Map Service). The TMS is a protocol that serves our products as a multitude of tiles at different scales.
This means that we offer access to all of our basemaps through online information feeds.
All layers (RGB, NIR, NDVI and RADAR) are made available through the TMS, as well as DEM data (Digital Elevation model). The resolution of optical and RADAR data is 10m resolution which corresponds to a zoom 14 for a TMS service.
This data can be consulted from the Earth Online platform or directly integrated into your web solutions or business applications with the appropriate TMS configuration and your token, available from the user section once you have created your Nimbo account. We have also designed a dedicated plugin for QGIS users, available directly from the QGIS repository Now the world is yours !