NDVI stands for Normalized Difference Vegetation Index. Well, this information is probably not helpful if you don’t know much about remote sensing. So let’s say, for starters, that NDVI is an indicator of vegetation health. It is based on the chlorophyll content in the plant, revealed by the way light is absorbed in the red side of the spectrum. How is it calculated, how does it help, and in what field ? Many, as we will see.
How is NDVI calculated ?
Basically, NDVI calculated from spectral imagery, like Sentinel-2, using the following formula:
NDVI = (NIR – Red) / (NIR + Red), in which:
NIR (Near-Infrared) is the reflectance of the Earth’s surface in the near-infrared spectrum and
Red is the reflectance of the Earth’s surface in the red spectrum
With such a formula, vegetation index values are bound to range between -1 tand 1, with higher values indicating healthier and more abundant vegetation. More specifically, if:
- NDVI is close to -1, you are looking at a non-vegetated or barren area, such as a water body or an urban area.
- NDVI is close to 0, this suggests sparse or stressed vegetation, like deserts or areas with limited plant cover.
- NDVI is between 0 and 0.2, the area of interest has low to moderate vegetation cover.
- NDVI is between 0.2 and 0.5, vegetation is moderate to dense, like grasslands or cultivated fields.
- NDVI is above 0.5, this is typical of very dense and healthy vegetation, such as thiving grassland, forests or tropical rainforests.
What is NDVI used for ?
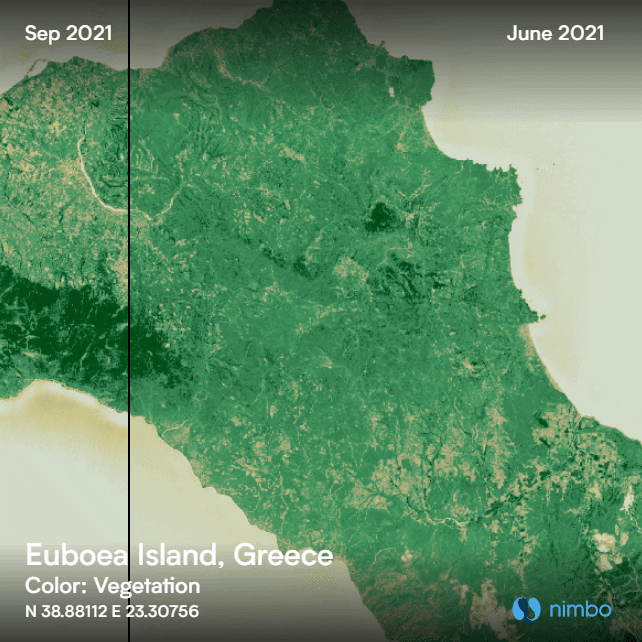
Based on this gradient, NDVI provides precious data for vegetation monitoring in a wide field of applications. Whenever plant or tree health assessment is involved, the Normalized Difference Vegetation Index will be of help : agriculture, environmental conservation, forest management, water management, post-disaster response. It is particularly telling, for instance, to assess wildfire damage, as in this before/after comparison in Greece’s Euboea Island, where 50,000 thousand hectares of forests were destroyed in 2021 :
As far as agriculture is concerned, NDVI will be an indicator of choice to keep an eye on the health of crops and their yield, subject to all kinds of threats such as water stress or pests. Hence the importance of the vegetation index to assist farmers in the use of irrigation, fertilization or pest control products.
Beyond direct plant health monitoring, this vegetation index also supplies information on plant vitality that are interesting to sustainable agriculture schemes. Calculations based on this indicator can be made to estimate biomass and thus vegetation’s carbon sequestration potential. Or soil cover duration throughout the year, in order to monitor and validate regenerative agriculture schemes – we do perform such tasks.
Finally, NDVI time series (ie successive images at different periods of the year) help establish typical profiles for various species. We use them as input for our crop identification deep-learning processes. Fields per se can be profiled too using NDVI, which allows us to achieve automatic field boundary recognition.
With Nimbo, worldwide NDVI basemaps updated every month
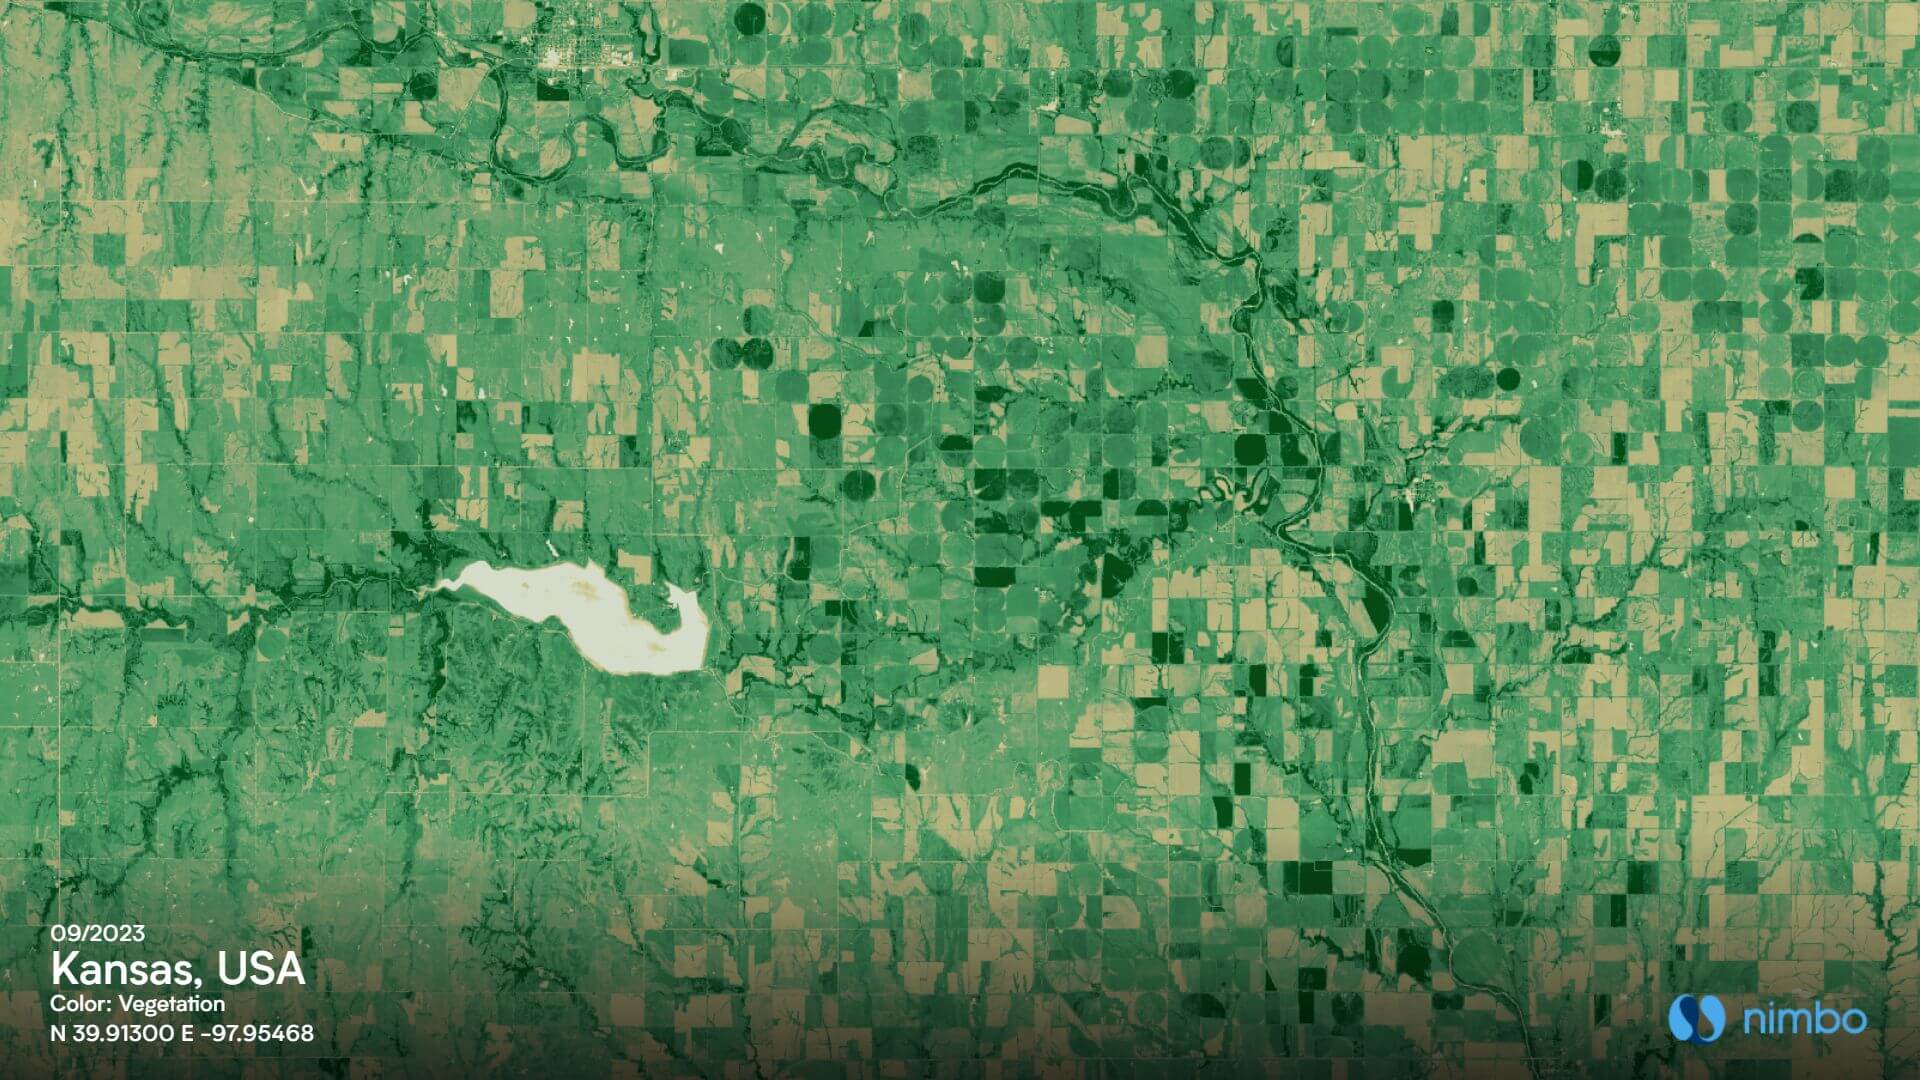
So there’s a wealth of information that can be derived from NDVI, useful for a wealth of applications. That is why our global NDVI basemaps come in particularly handy. Note that their beige-to-green palette is just conventional, and are here to translate information that are invisible to the human eye.
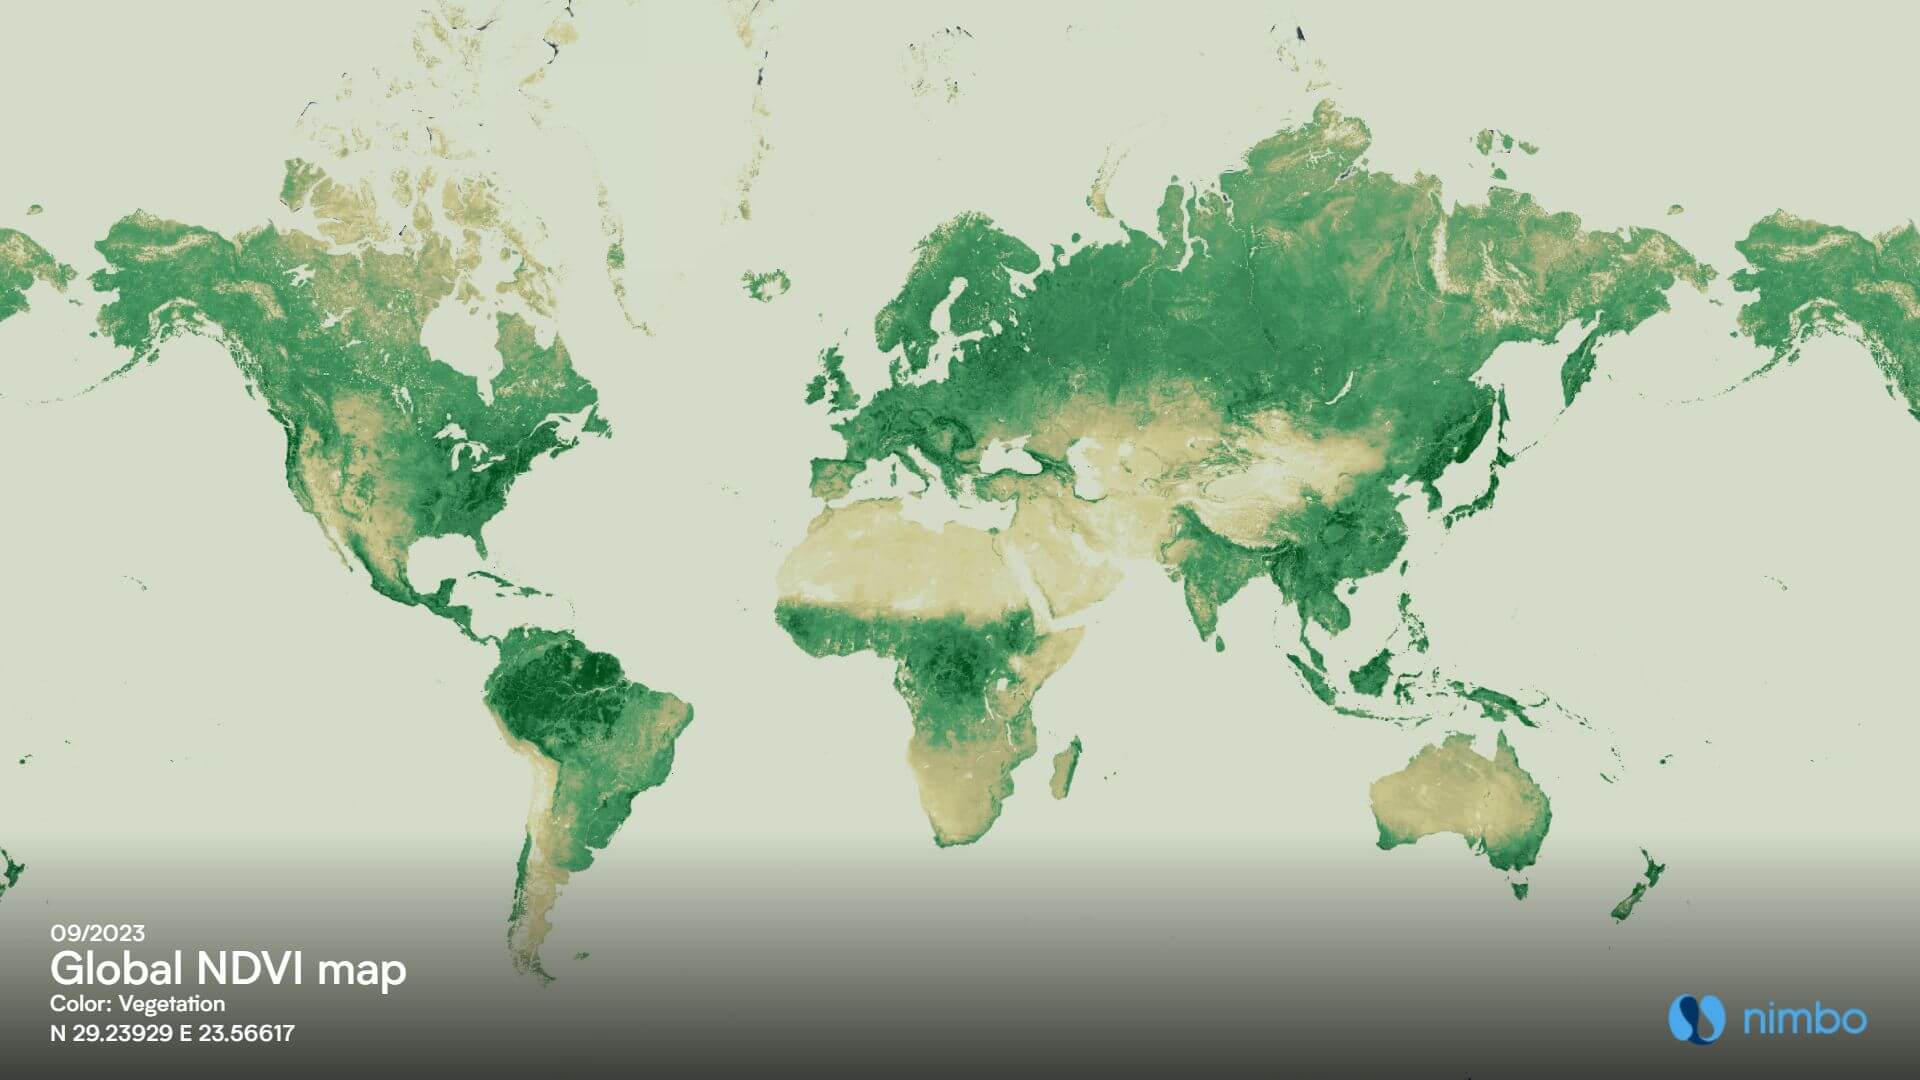
These worldwide vegetation maps are all available through Nimbo’s Earth Basemaps, and can be retrieved in your GIS software using our API. Where do you find said API access ? In your customer account once you have signed up to Nimbo, for free !
If you are a QGIS user, there is even a dedicated plugin to acces all our NDVI basemaps. All you need is your Nimbo user ID to log in, or your API token to directly connect to your account.
Alternatively, with a Nimbo account, our worldwide NDVI maps can also be explored through the Earth Online platform. Also for free, with monthly maps dating back to October 2019 for Europe and the Middle East, March 2022 for the USA, and March 2023 worldwide.
Reading NDVI data on Earth Online
Exploring our global NDVI maps on Earth Online will let you access an extra feature : a dynamic NDVI graph providing information on the indicator’s evolution anywhere on Earth. You can either click on the map to get data at pixel level (corresponding to a 10 sq.m area on the ground) and retrieve the evolution of the vegetation index on this given spot. Or draw an area to get an average NDVI figure for the zone of interest :
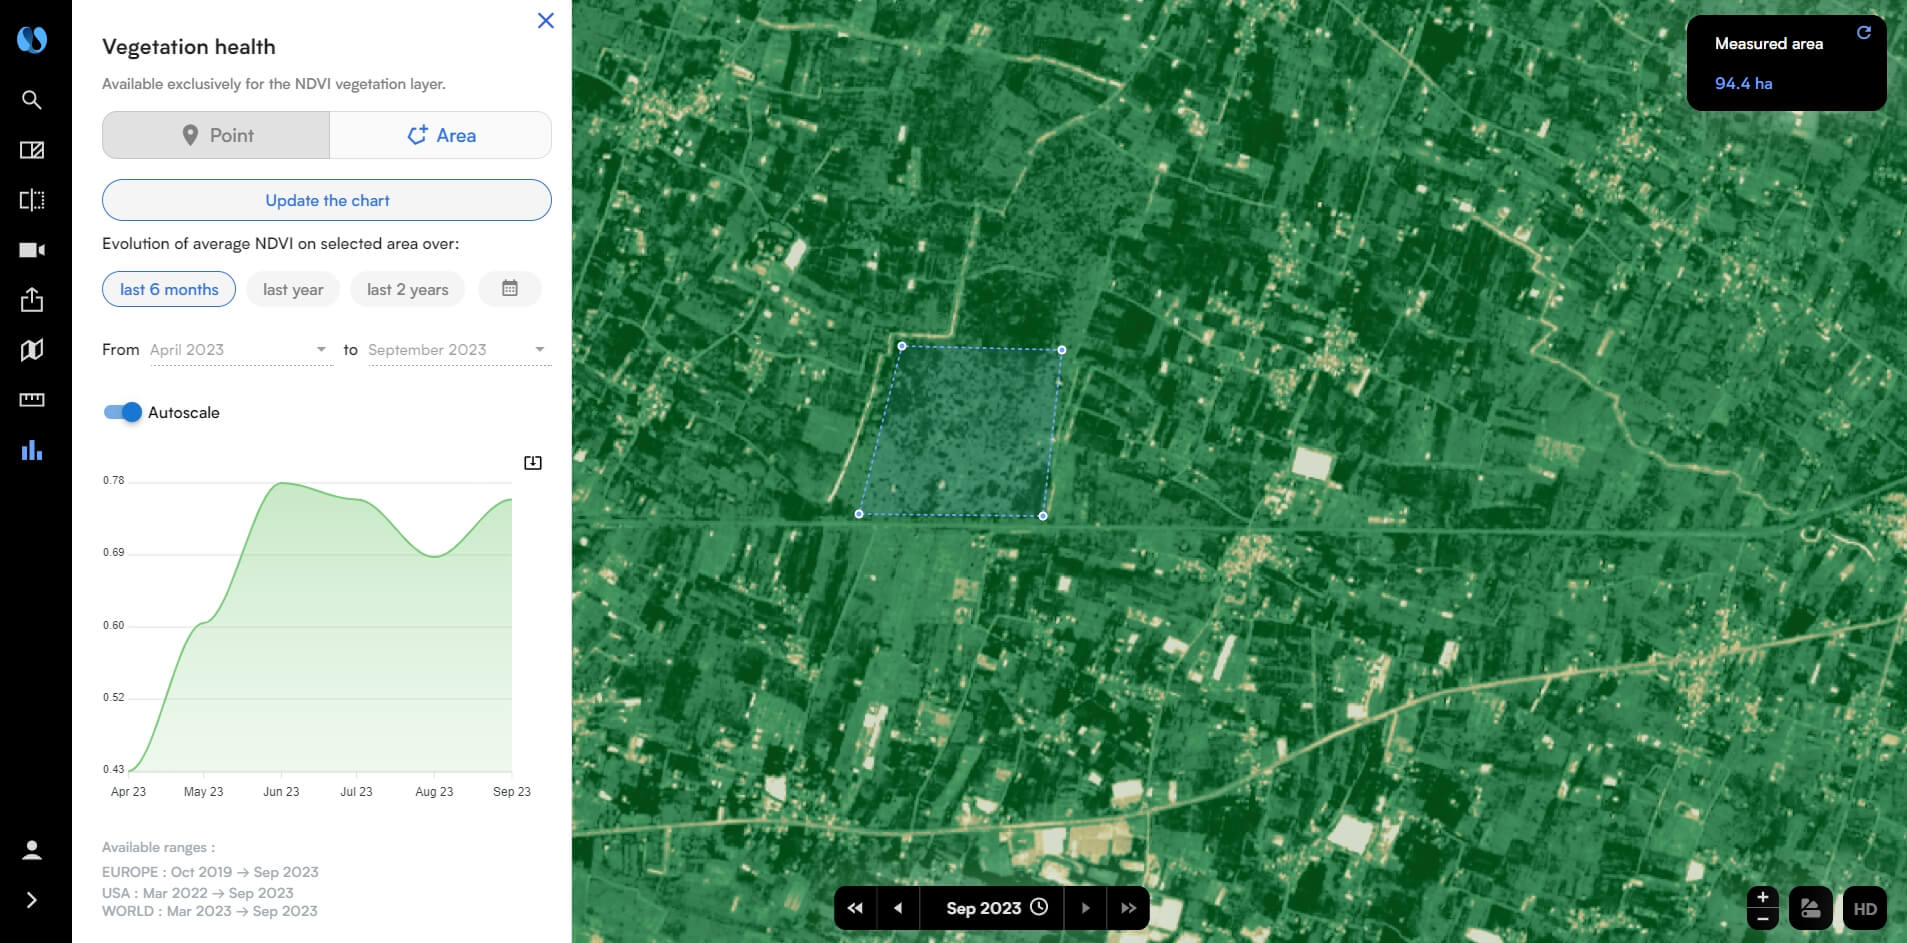
In both cases, the graph will display automatically, with also the possibility to export the result in SVG, PNG or CSV format.
Another vegetation index beyond NDVI : Nimbo’s LAI
For all the information it provides, NDVI has its limitations. One is that it is this vegetation index is purely based on spectral analysis. As such, it is prone to saturation in the upper values, when vegetation is healthy and/or abundant. In these contexts, NDVI will thus be blind to variations in vegetation vitality, and miss early warnings of water stress or disease outbreak.
For specific needs and situations, more robust vegetation indices are necessary. One of them is the Leaf Area Index, or LAI. As its name suggest, this indicator supplies information on foliage density. It is also calculated from satellite imagery, but involves deep-learning processes that prove performant even in densely vegetated environments. There, LAI has a significant edge over NDVI not only for vegetation health monitoring, but also for the production of specific data such as biomass quantification and yield estimation.
These LAI basemaps are available from Nimbo too, get in touch with our sales team to know more !