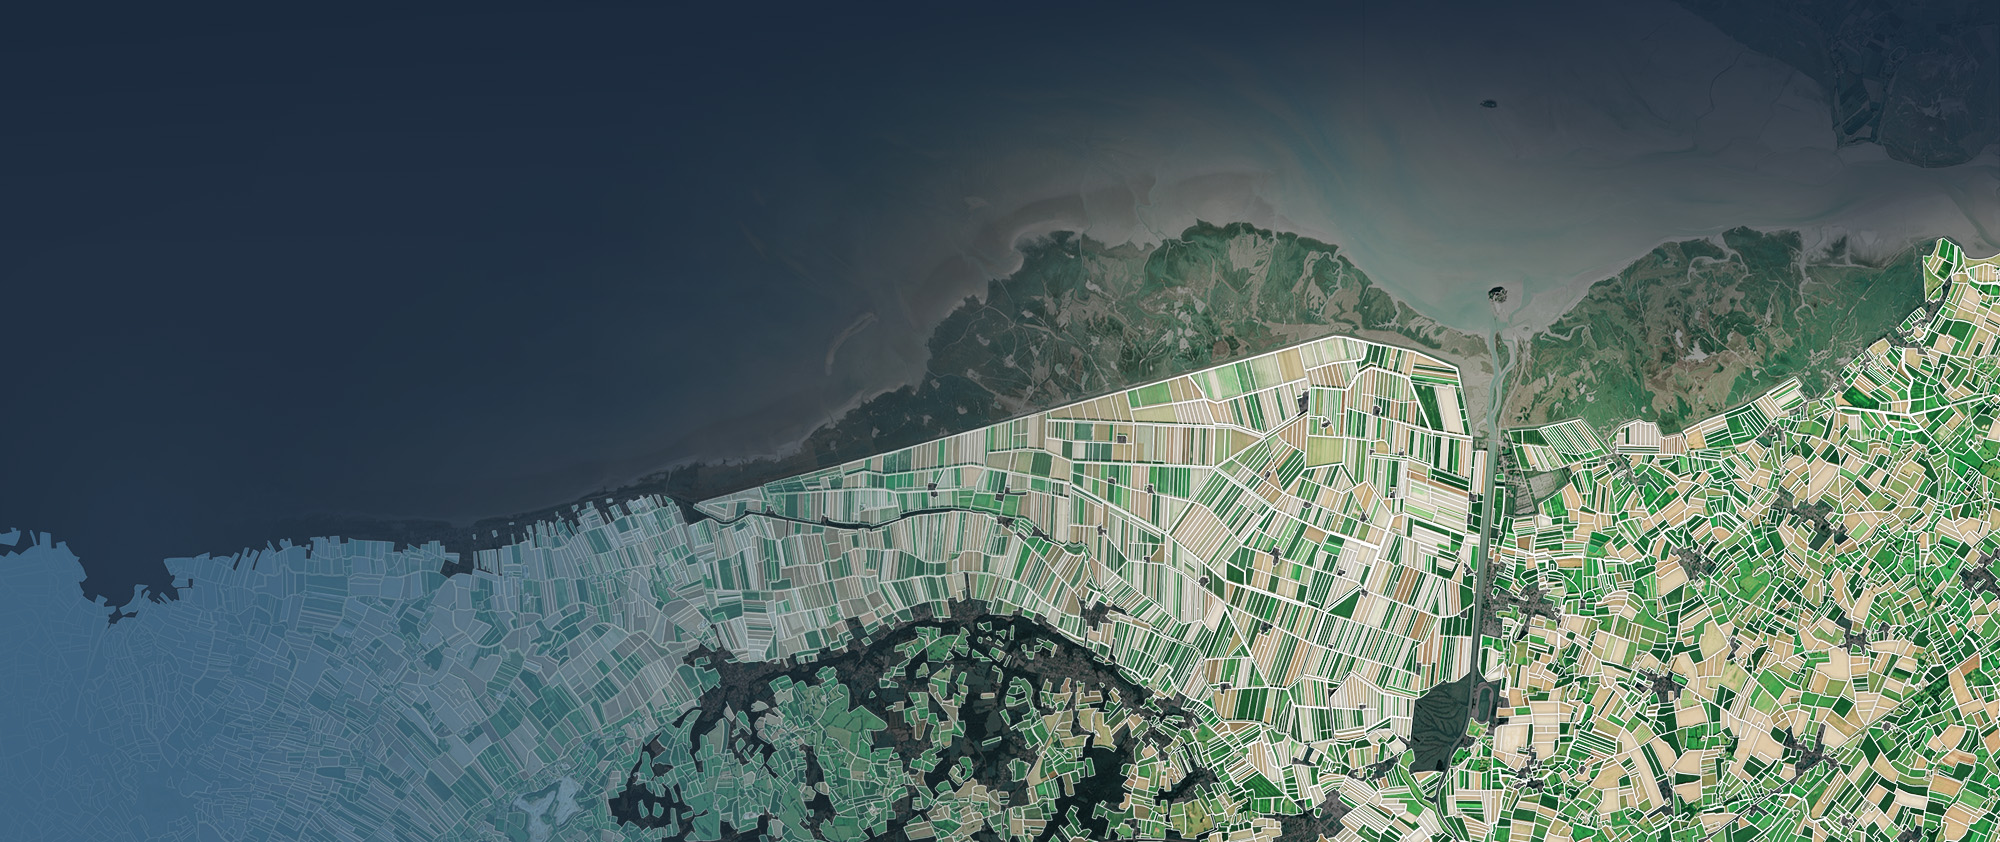
Precise, up-to-date user-ready information on field contours is a time and hassle-saver on the administrative side, both for farmers and relevant authorities. But field delineation data also proves essential when it comes to estimating in-season crop areas, volumes and related farm practice indicators, as track by our satellite analytics. All these needs can be met by AI-driven automatic field boundary detection, using computer vision based on Nimbo’s satellite basemaps.
Why automatic field boundary detection matters
Along with the farming industry’s growing trend towards digitization, a variety of crop monitoring applications and agriculture information systems need pre-processed field boundaries obtained from satellite imagery. That’s a huge time-saver for users, who don’t have to manually input field limits into their system. Specifically for farmers who must declare what they grow on their land, and the various authorities tasked with controlling said declarations.
But there’s another point to automatic field boundary detection : getting to know what is currently growing where, and anticipating in what quantity. Precise information on field limits derived from Earth observation is the prerequisite for crop area estimation, which, along with yields, will give you volumes. At times of great uncertainties regarding food commodity availability, obtaining this information as soon as possible, before crops are harvested, is crucial.
Beyond food security, knowing in advance how much will be produced on a given territory has environmental benefits too, as it helps a host of players in the farming industry better plan and optimize their transport and storage strategy to minimize their carbon emissions.
Elusive field limits
Why is it so difficult to get precise information on field boundaries ? Let’s say that, when official field boundary data exists, which is already a lot, it is not necessarily exhaustive, and is generally made available long after the farming season. In open data if you’re lucky.
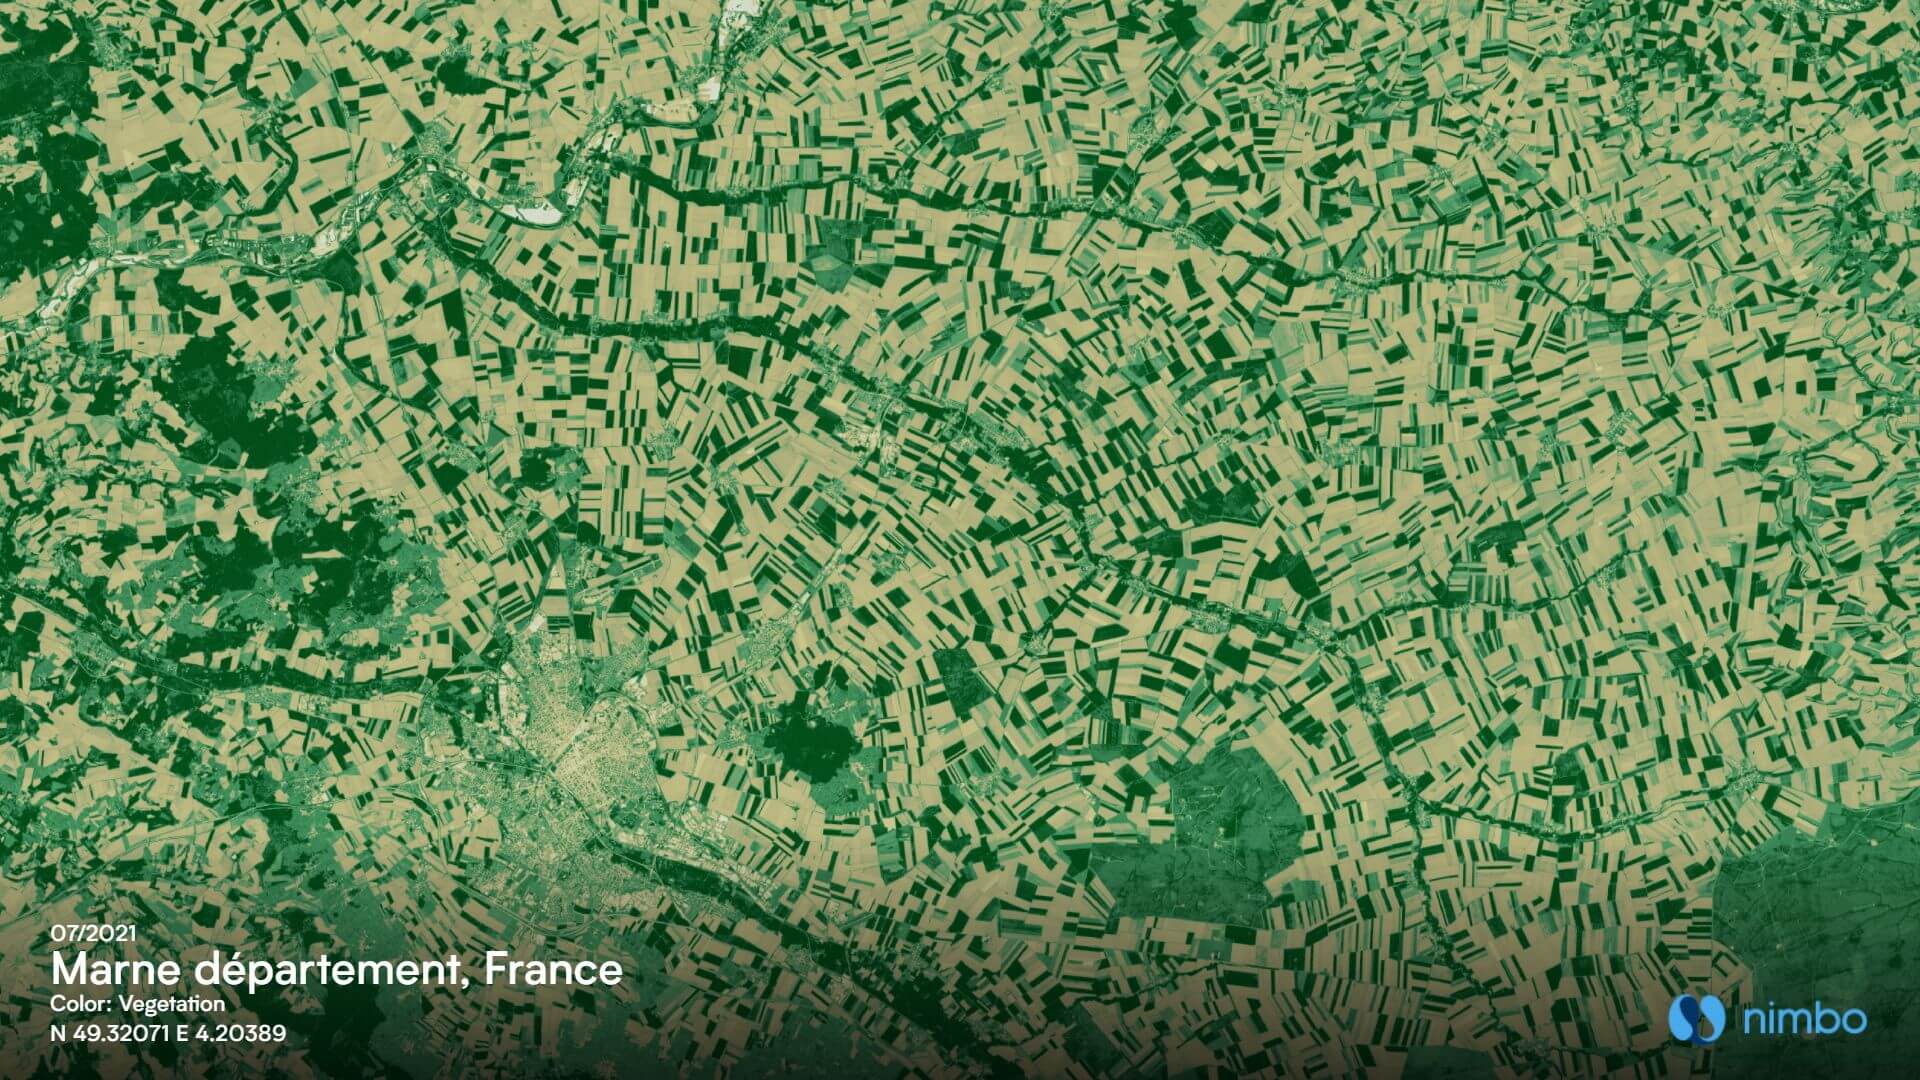
That’s the case in France, which has had a field boundary database for some time now. It is called RPG, shorter for Registre Parcellaire Graphique, and it is widely useful. It compiles the position and geometries of all fields declared as cultivated by farmers, for them to receive subsidies from the European Union. Well, almost all, as some operations do not apply for EU aid, such as winemakers for example. Coverage is therefore not extensive, and there is another issue : RPG is updated annually, but only goes public about 12 months after the farming season.
That’s a long time in today’s agriculture. Field boundaries are relatively stable, but far from immutable. Farmland sales and acquisitions, changes in rotation strategy or in field use for non-farming purposes, to name a few, account for a significant amount of modifications every year. For remote sensing data to accurately describe and measure what’s going on in any farming operation, geometries have to be updated annually. Another argument for automatically detecting field boundaries.
Training our field delineation model with Nimbo
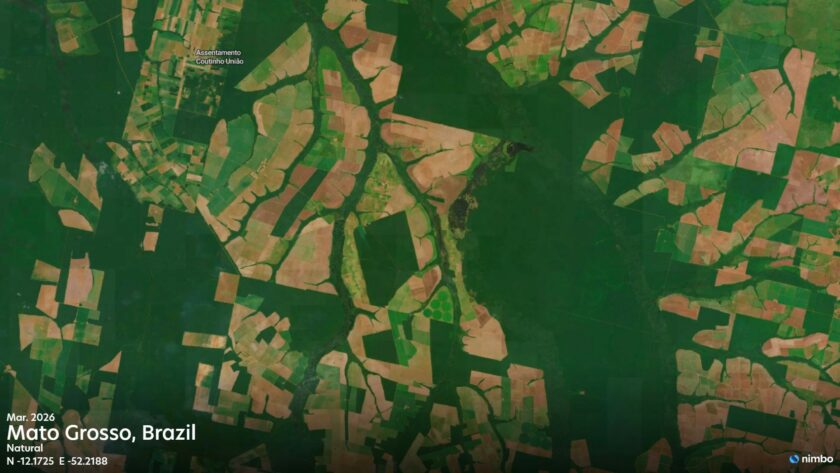
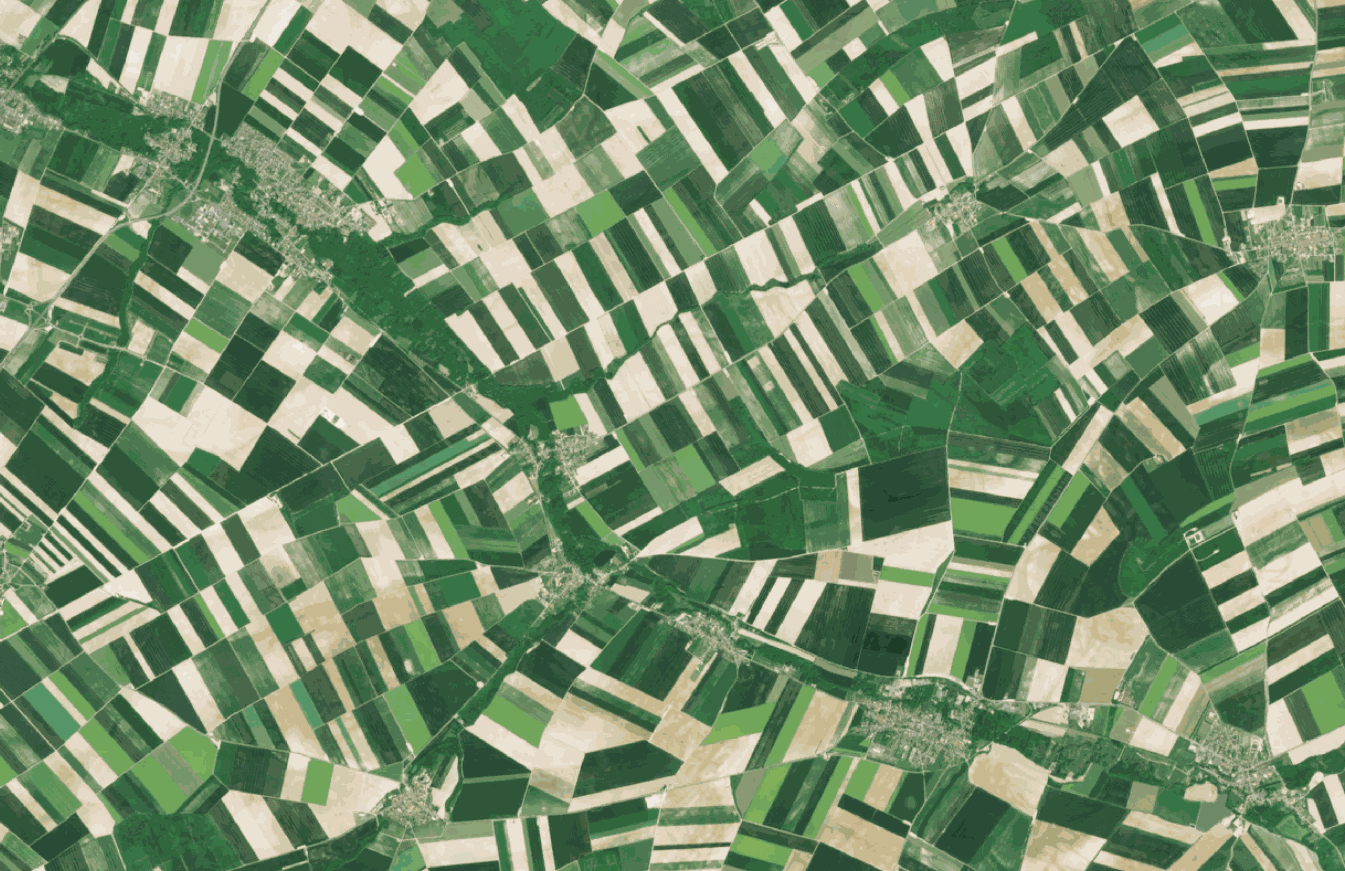
The starting point to have an AI model automatically identify field limits is… to show it fields. And to teach it to match them to the corresponding geometries, such as those found in the RPG or its European counterpart, the Land Parcel Identification System (LPIS). For this training stage, we have used field samples coming from NDVI layers covering four months of interest (March, May, July and September) in various European countries. These came from Nimbo Monthly Basemaps, our proprietary monthly syntheses based on Sentinel-2 imagery.
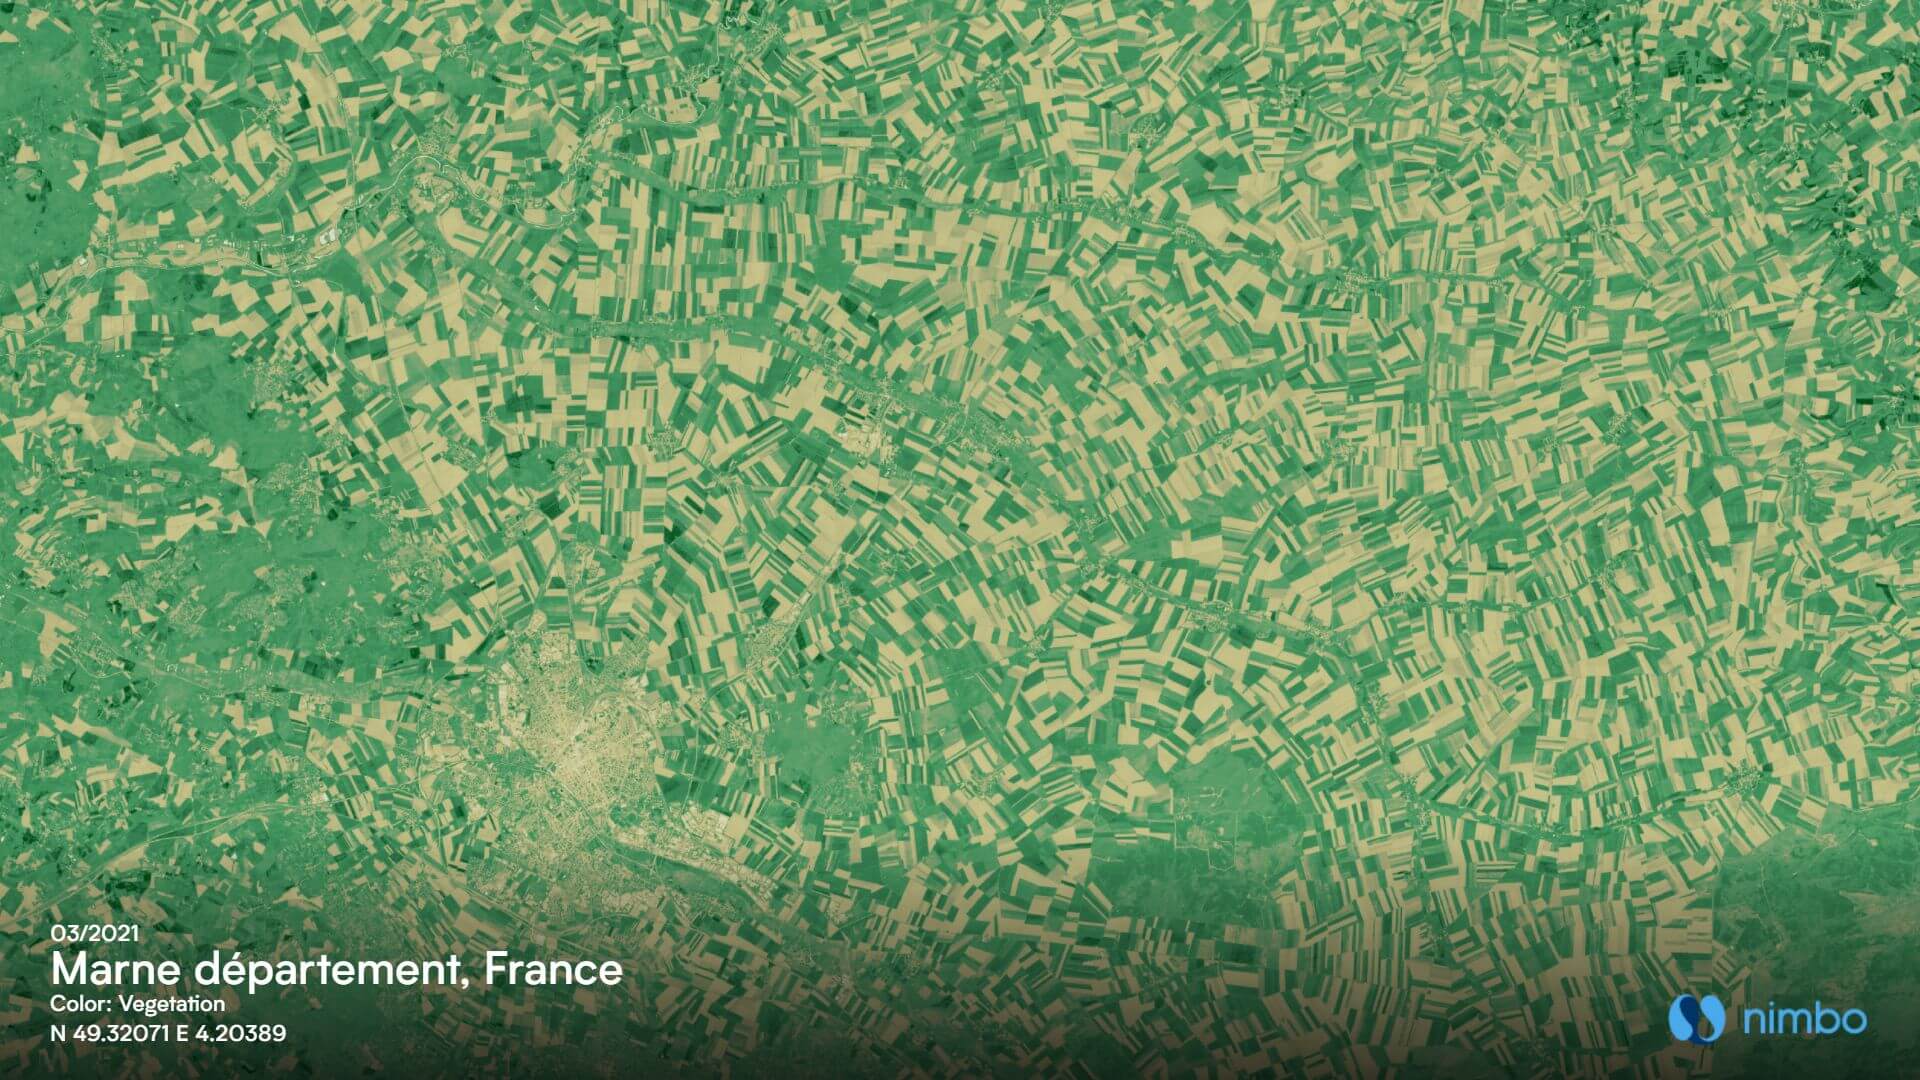


Why choose NDVI ? Because it implies feeding the model with only one input parameter, instead of three if we had chosen RGB images. This one band is sufficient for the model to spot breaks from one field to another, which significantly lightens input data which the model has to process afterwards.
Why use images from different months ? Because we had noticed that the difference between contiguous fields was hardly visible during a given month, but became more obvious on earlier or later images. This sure called for our model to take the time dimension into account. There, using NDVI is also a plus, since it is lighter to process than a combination of R,G,B and NIR over four months.
Why from Nimbo basemaps ? For consistency’s sake, since these basemaps are also the ones used for output. And for efficiency’s sake too, since, once the model has been trained, it will have to perform its task over huge areas. At country level, up to full European coverage. And Nimbo holds a significant benefit over raw Sentinel 2 imagery : it has all clouds removed. So that, when entering production, no such element will block the view and prevent the model from seeing what it has been taught to recognize.
From pixel classification to field boundaries
So now that we have our field samples, how does our computer vision model matches them with boundaries ? The idea is to teach it to predict, for each pixel, if it is in a field or not, if it is on a border between two fields or not. This comes down to a semantic segmentation process where the model is tasked with identifying all that is field and all that is border, with the ultimate goal of instantiating both into delineated fields.
The architecture chosen for this task is a UNet network, which has proved much more agile than more complex, but also heftier architectures initially tested. The latter had turned out to be excessively slow in the learning stage and quite demanding infrastructure-wise, let alone their tendency to overfitting.
After experimenting with various models and optimizing our training database to retain only high-quality samples, we have achieved a satisfying version, both in terms of reliability and velocity. This is efficient and operational so as to meet the needs of a variety of players in the farming business, but also to feed Kermap’s own field monitoring tools. The challenge is now to make it even better : this implies training the model with yet more quality data, an ongoing process for Nimbo’s engineers. Stay tuned !