Over the past few years, we’ve seen the same pattern repeat itself.
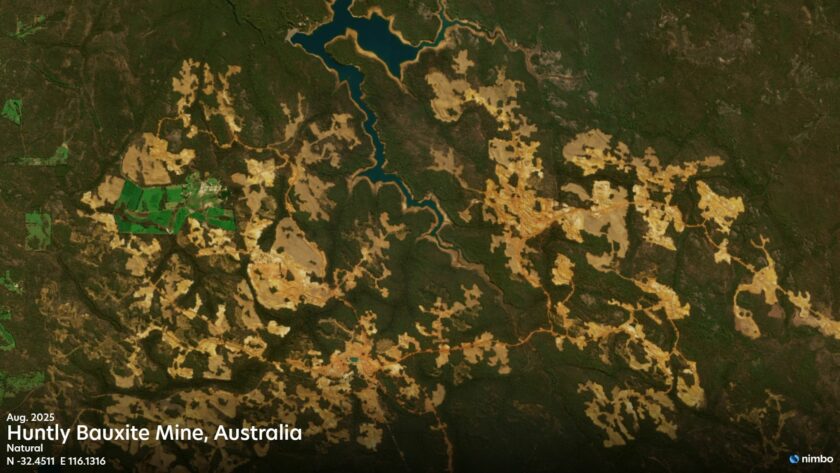
A startup founder, an NGO analyst, or a GIS lead reaches out because they urgently need reliable satellite imagery. They might be tracking deforestation, monitoring urban expansion, or keeping eyes on a mining site that changes month by month.
So they search for satellite imagery providers, and find one with the perfect, clean, and high-resolution imagery.
Then they look for the price.
Instead, they get a “Contact Sales” button.
A form appears: industry, area of interest, intended use, budget, timeline. A few days of emails and perhaps signing an NDA later, they finally receive a quote. And it often looks like it is priced for a massive enterprise contract rather than a standard commercial budget.
The result is a barrier to practical access for teams focused on output rather than administration. This level of procurement friction has effectively become an accepted industry default.
Why does satellite imagery pricing still rely on custom quotes?
For decades, Earth Observation (EO) lived exclusively in the world of defence contracts, government procurement, and enterprise licensing. Data was scarce, distribution was complex, and each deal was a custom negotiation. Today, satellite constellations have scaled up massively, but that traditional procurement mindset still remains. It has simply been repackaged behind modern websites.
To be fair, pricing in this sector is genuinely complex. When providers say that “pricing depends on specific needs”, they’re not entirely wrong.
The cost fluctuates based on several real factors:
- Coverage: Monitoring a single city costs far less than covering an entire continent.
- Spatial resolution: Prices rise as you move from standard 10m imagery to 30cm high-definition data.
- Recency: Accessing historical archives is generally more affordable than requesting fresh satellite tasking.
- Usage rights: A standard internal analysis licence is priced very differently from one built for public redistribution.
- Delivery format: Downloading raw scenes involves different processing and hosting costs compared to piping curated, high-speed data directly through an API.
Because of these variables, pricing stays open to negotiation. However, this lack of standardisation limits the scalability of the broader industry.
Developers are now used to forecasting cloud and API costs in seconds. But without a clear EO price list, teams often spend weeks just trying to secure internal approvals, pushing project timelines back by months.
You’re rarely just paying for pixels
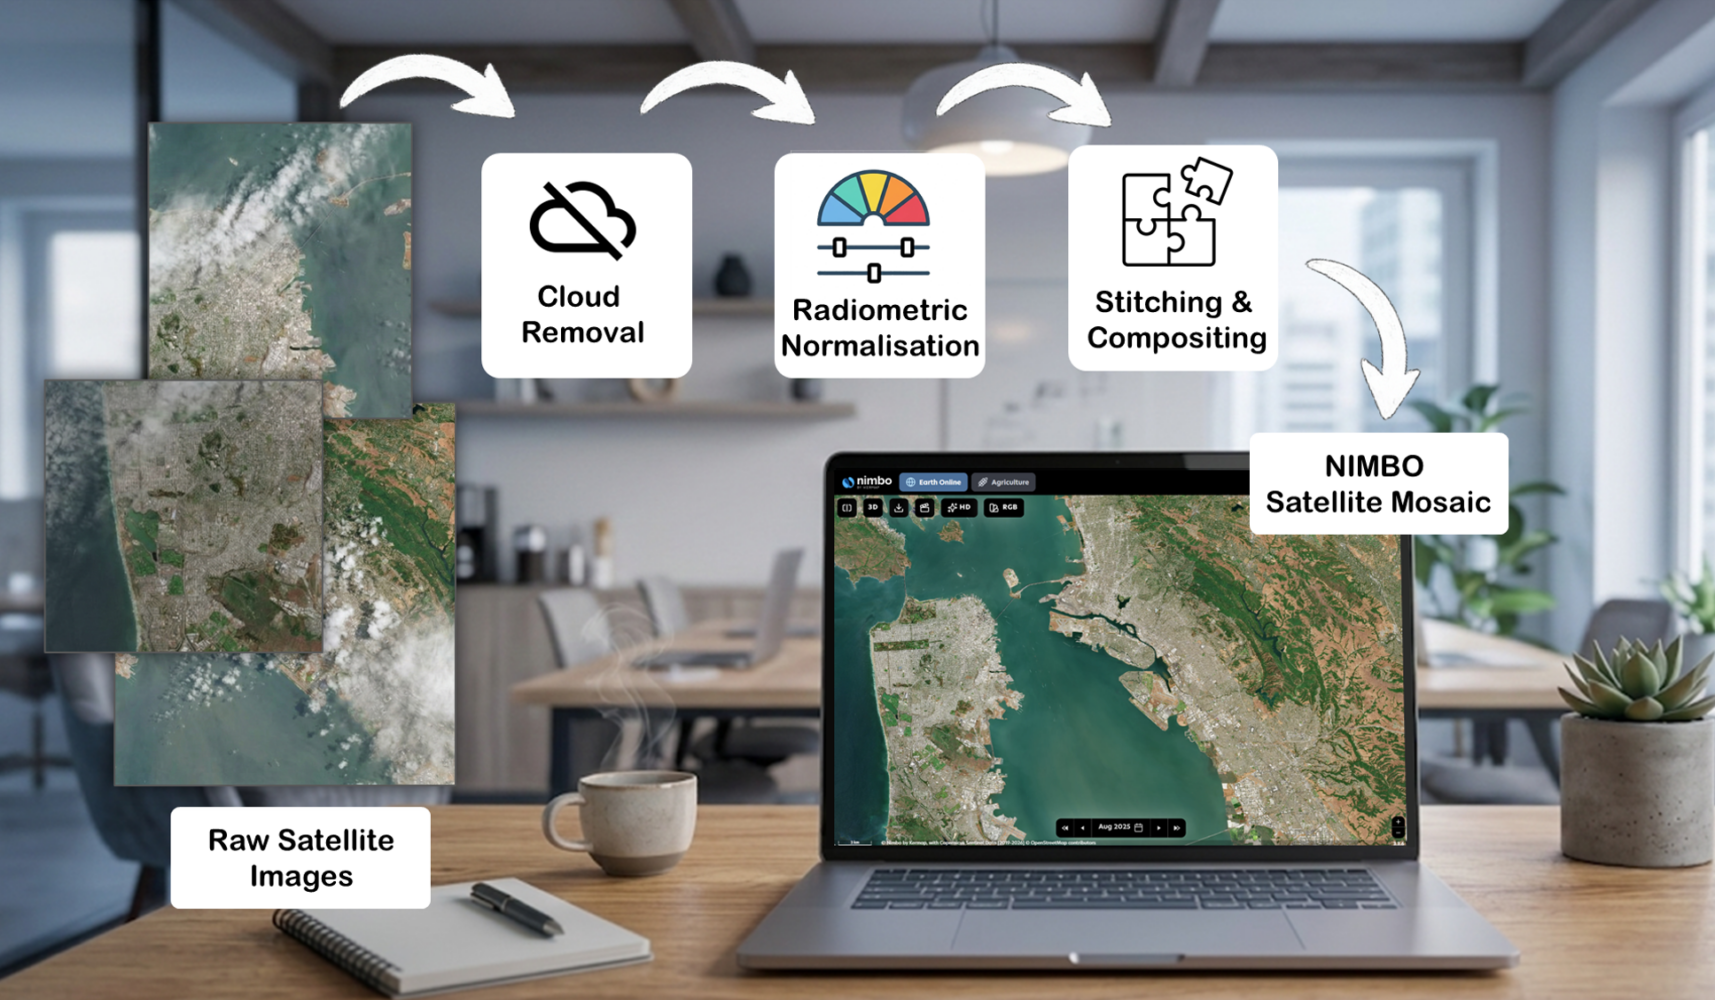
When teams receive a heavy quote, they usually assume they are just paying for raw satellite imagery (the pixels). But what their workflows actually require is a satellite mosaic: a clean and continuous basemap.
Raw pixels themselves are rarely the main cost driver. Most of the expense lies in the engineering required to transform fragmented satellite scenes into a professional-grade resource. The bulk of the price tag hides in the processing pipeline, which typically involves:
- Search and ordering workflows: Identifying and retrieving the right scenes from fragmented databases.
- Cloud and haze handling: Removing atmospheric interference to recover usable ground information.
- Radiometric normalisation: Ensuring colour and brightness consistency across images captured on different dates and under different conditions.
- Compositing logic: Selecting and stitching scenes together without visible seams.
- Hosting infrastructure & delivery performance: Storing, processing, and streaming large datasets efficiently into GIS platforms and APIs.
- Licensing and downstream usage rights: Defining how the imagery can be used, shared, or integrated into downstream products.
This massive processing overhead is exactly why a universal price list is so rare. Instead, the market has fractured into two very different worlds.
World #1: High-resolution scenes sold by area (km²)
In this world, the complex steps of cloud removal, radiometric normalisation, and stitching are often treated as customised engineering services. Pricing is dictated by minimum order sizes and specific licensing terms. Archive imagery at 30 to 50 cm resolution typically costs tens of dollars per km². This model makes perfect sense if you need extreme detail for a single location at a specific time, particularly when fresh tasking is involved.
But if what you actually need is a clean, continuously updating mosaic streaming directly into your workflows, this per km² model turns into a massive and unjustifiable expense.
World #2: Curated basemaps and mosaics built for monitoring
However, if your goal is not to count individual cars or identify defence objectives, but to track forest change, agriculture, or urban growth over time, the priority shifts from extreme resolution to temporal reliability and workflow efficiency.
Teams simply need a repeatable, comparable, and cloud-free view of the exact same target area month by month. For this kind of continuous access, pricing shouldn’t be a custom procurement negotiation. It needs to function like a modern subscription.
In this world, we have built Nimbo to automate the entire transformation process to make this subscription model possible. Instead of selling this processing as a bespoke service, we engineered it directly into our automated infrastructure:
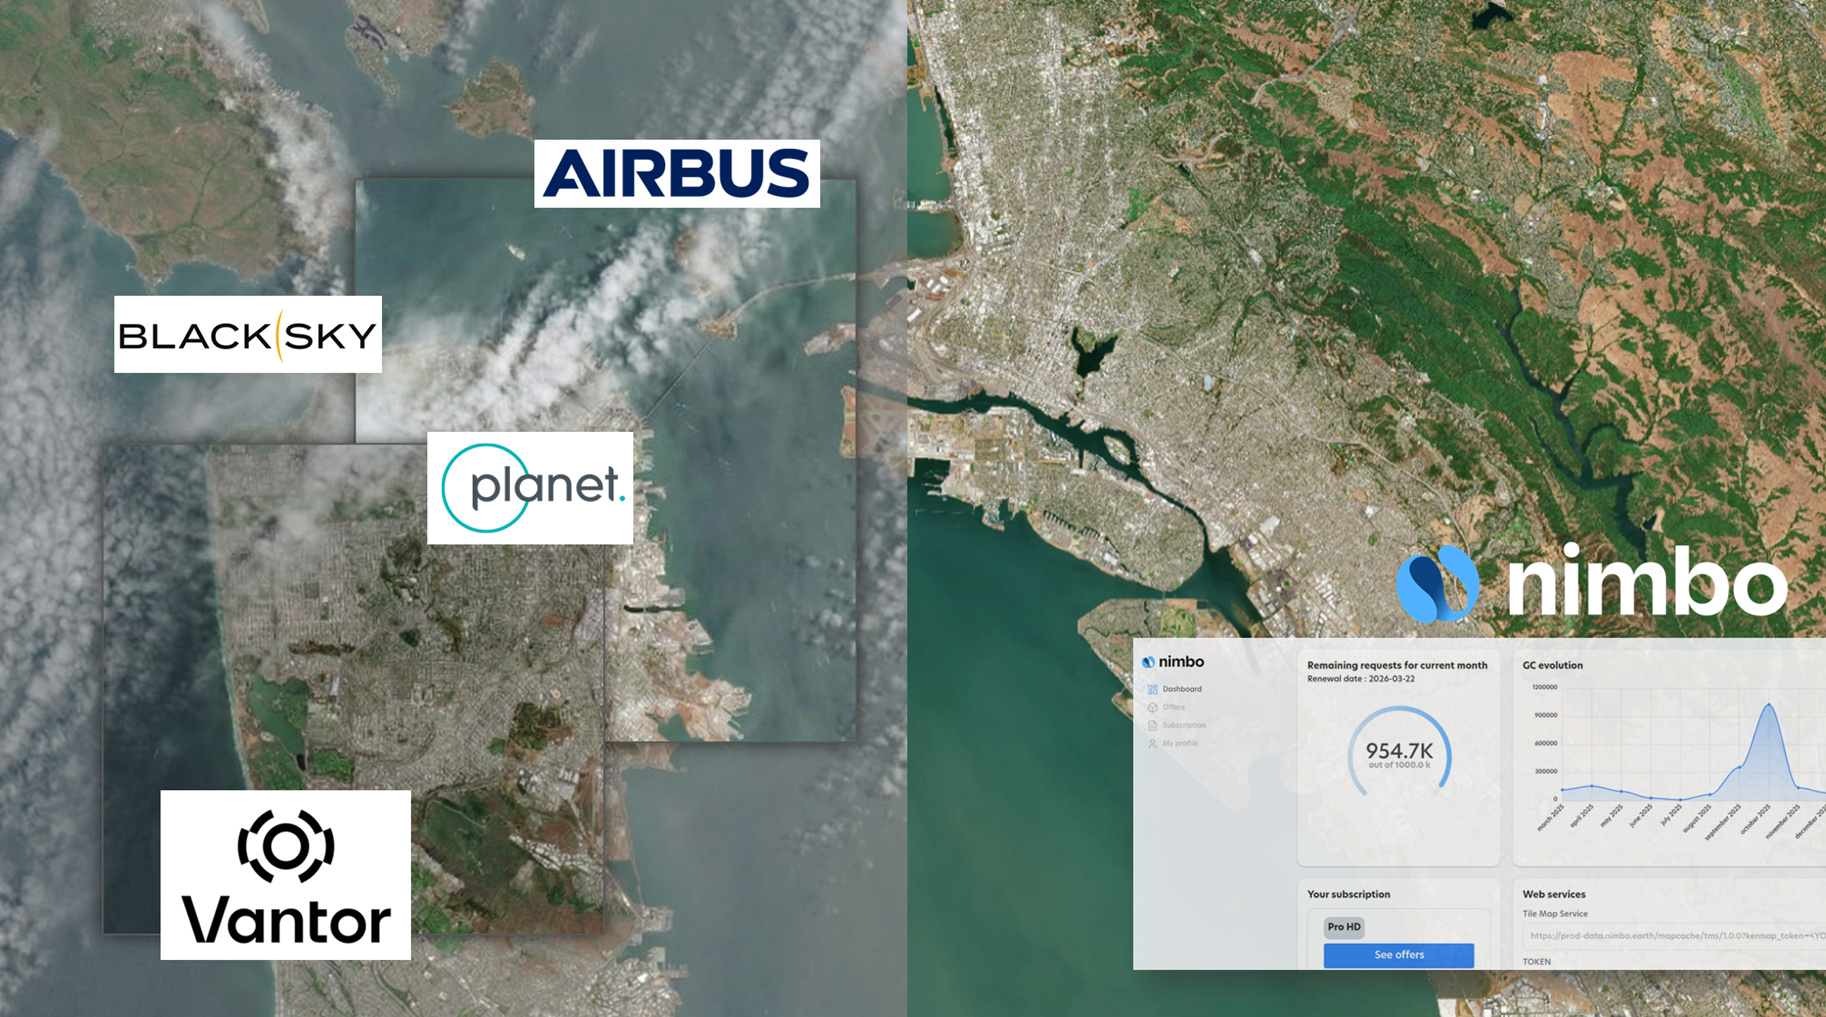
Why is it very hard to compare Planet, Airbus, BlackSky, and Vantor?
Even when you understand the two worlds, it’s still not easy to compare major providers, because they are actually built for entirely different workflows.
- Planet Labs: Their reputation is built on high revisit frequency. For example, their Tropical Forest Observatory was introduced as a paid monitoring option with estimated pricing historically starting around $180 per month for 5m mosaics.
- Airbus Defence and Space: Although they promote curated basemaps via OneAtlas, most commercial transactions still require a direct request for a quote. Ordering remains a complex mix of subscriptions or pay-per-order, depending on the specific archive.
- BlackSky: This provider focuses on time-sensitive intelligence workflows. Their “on-demand” subscriptions are usually quote-based, with specific licensing and user tiers defined by contract.
- Vantor (formerly Maxar): Positioned at the top end of high resolution, their pricing is the most variable in the industry. While resellers may publish indicative numbers, the final cost depends heavily on whether you need archive imagery or fresh tasking.
These Earth Observation business models were structured to serve government agencies and enterprise buyers, organisations equipped with multi-year budgets and dedicated imagery specialists.
Platforms like SkyFi and SkyWatch have stepped in to make things easier. They put multiple providers into a single storefront and made high-resolution scenes instantly available online. If you need a specific image for a targeted location, at a specific time, their model is exactly what the industry needs.
But when a project demands continuous regional monitoring, acquiring premium high-resolution scenes means the costs quickly multiply. Buying standalone scenes is also just the first step. Teams still need an internal pipeline to remove clouds and stitch fragmented images into a usable basemap.
Today’s users are small GIS teams, climate startups, ESG analysts, and developers building data-driven products. They rarely have the bandwidth to negotiate complex licensing, sign NDAs simply to view pricing, or build heavy processing pipelines from scratch.
Their priority is getting straight to the analysis; they want satellite data to behave like infrastructure.
Nimbo: Satellite data as infrastructure
Nimbo was designed to treat satellite data as infrastructure. The goal is simple: deliver a reliable satellite basemap so your team doesn’t have to act as imagery specialists.
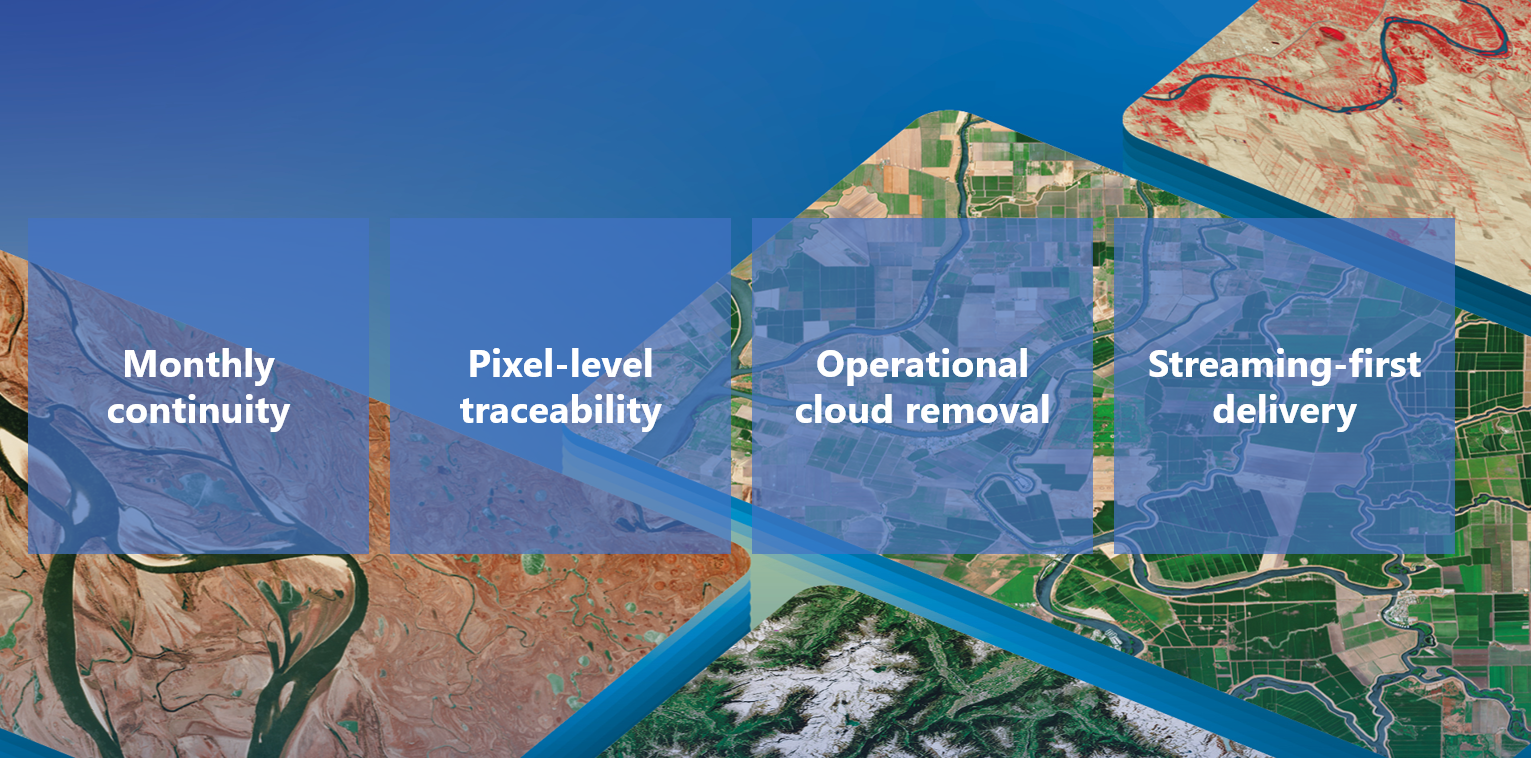
- Monthly continuity: Standard basemaps often combine imagery from multiple months to achieve a cloud-free image. Nimbo prioritises temporal accuracy instead. We build our mosaics using data strictly from a single month, ensuring the image represents a genuine point in time. For reliable change detection and time-series analysis, this consistent temporal baseline is essential.
- Pixel-level traceability: When a mosaic is built from multiple acquisitions, data provenance is usually obscured. To solve this, Nimbo includes a dedicated traceability layer. This allows users to easily verify the exact acquisition timestamp and source for every single pixel. In professional monitoring, this level of transparency is often the difference between a pretty picture and scientific evidence.
- Operational cloud removal: We don’t just use rigid binary masks that struggle with haze. We run all imagery through a custom U-Net model to isolate clouds and shadows probabilistically. It cleans up the atmospheric interference at the pixel level, meaning the data is actually ready for your models.
- Streaming-first delivery: A mosaic is only valuable if it lives where you work. We deliver Nimbo through standard formats (TMS and WMTS) to ensure it streams into your tools instantly.
Satellite data as a ready-to-use resource
If your project requires 30 cm imagery for specific sites with complex tasking, the traditional per km² model remains your best bet. But for continuous monitoring of certain areas, the priority shifts from “minimum order thresholds” to “workflow efficiency”. The real questions become:
- How fast can you test the data?
- How easily does it integrate into your GIS?
- How predictable is the budget over the next three years?
Meeting those needs requires treating satellite data as infrastructure. That means predictable pricing, public rates, and an end to custom quotes and complex licensing tiers. This approach allows teams to budget for scale without having to navigate a complex purchasing process every time their project grows.
This is exactly why Nimbo operates on a straightforward subscription model.
You can use the free tier to validate whether the data fits your use case. Instead of locking you into a massive enterprise contract, production-ready streaming starts at €20/month. You simply select the tier that matches your scope. You test the data today, know your exact budget tomorrow, and scale your subscription naturally as your project grows.
No NDAs just to see a price list. No guessing games. And no hidden enterprise contracts the moment you need to move into production. By ensuring data teams never have to act as procurement negotiators, they can focus entirely on actual analysis. This streamlined accessibility empowers the Earth Observation market to scale effortlessly beyond government giants.
This is the new standard: satellite mosaics as a universal infrastructure—transparent, predictable, and accessible to everyone without barriers to entry.