Nimbo Crop ID
Power Your Decisions with Early Crop Data
Access detailed crop mapping and analytics with satellite insights available well ahead of traditional sources


96%
Average identification accuracy
2 Bn
hectares monitored since 2018
28
countries available, rest of world on demand
Get Actionable Crop Insights. Fast, scalable, user-ready.
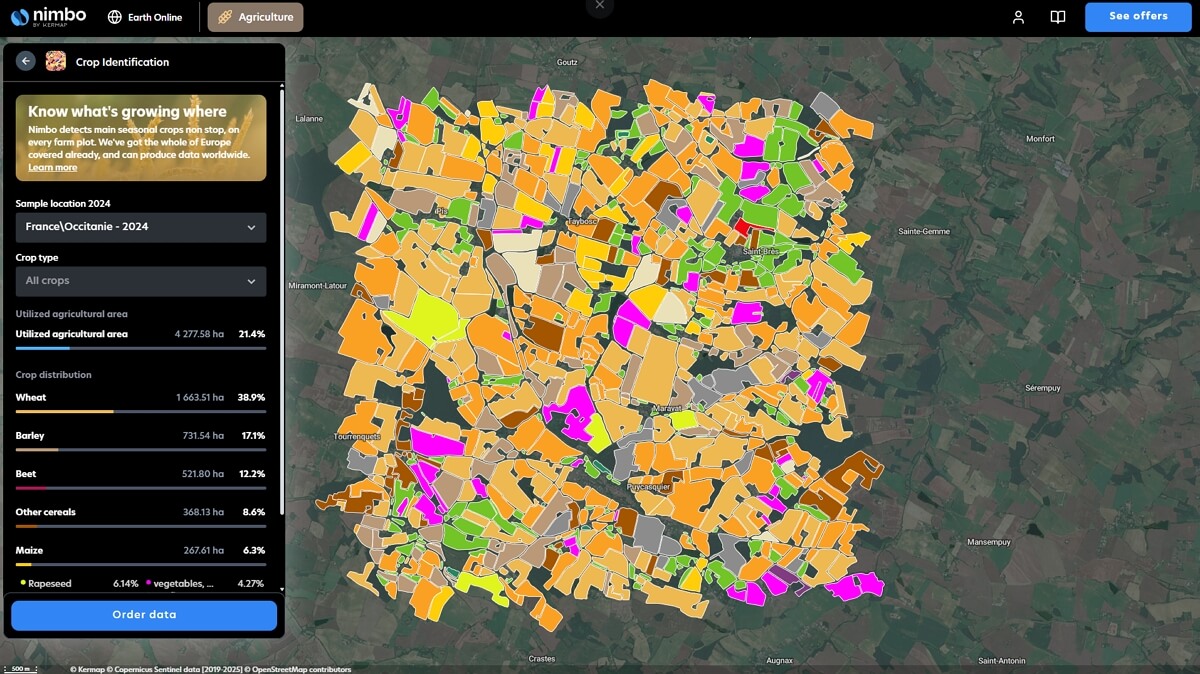
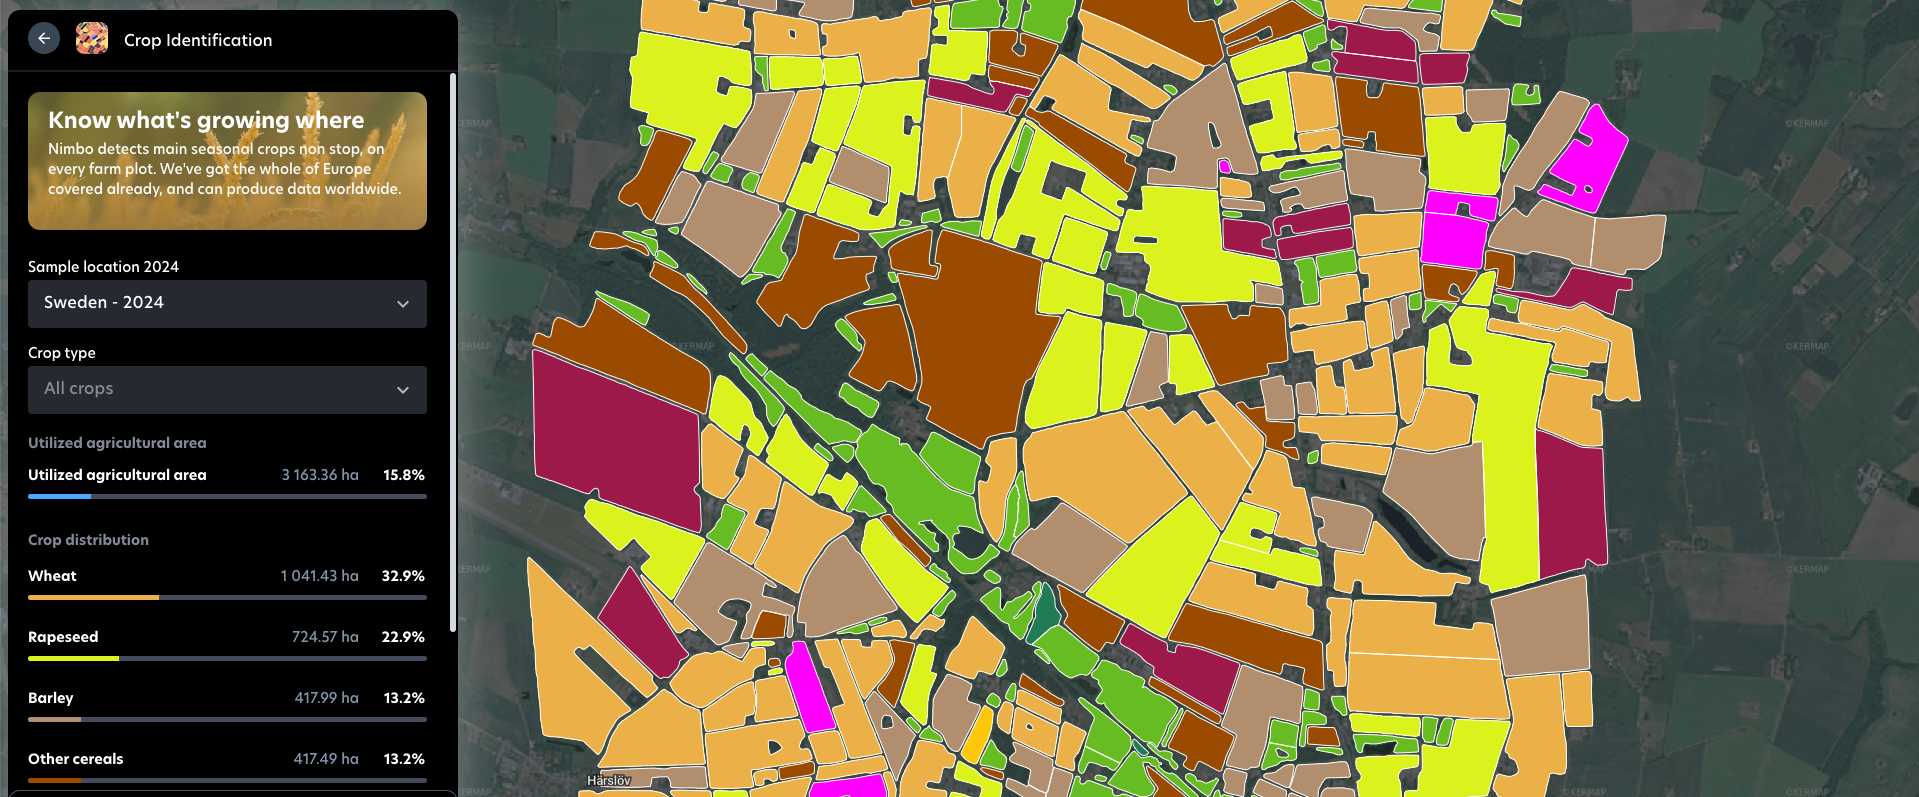
The shortest way to Nimbo analytics
Discover Crop ID by Nimbo on our Earth Online platform
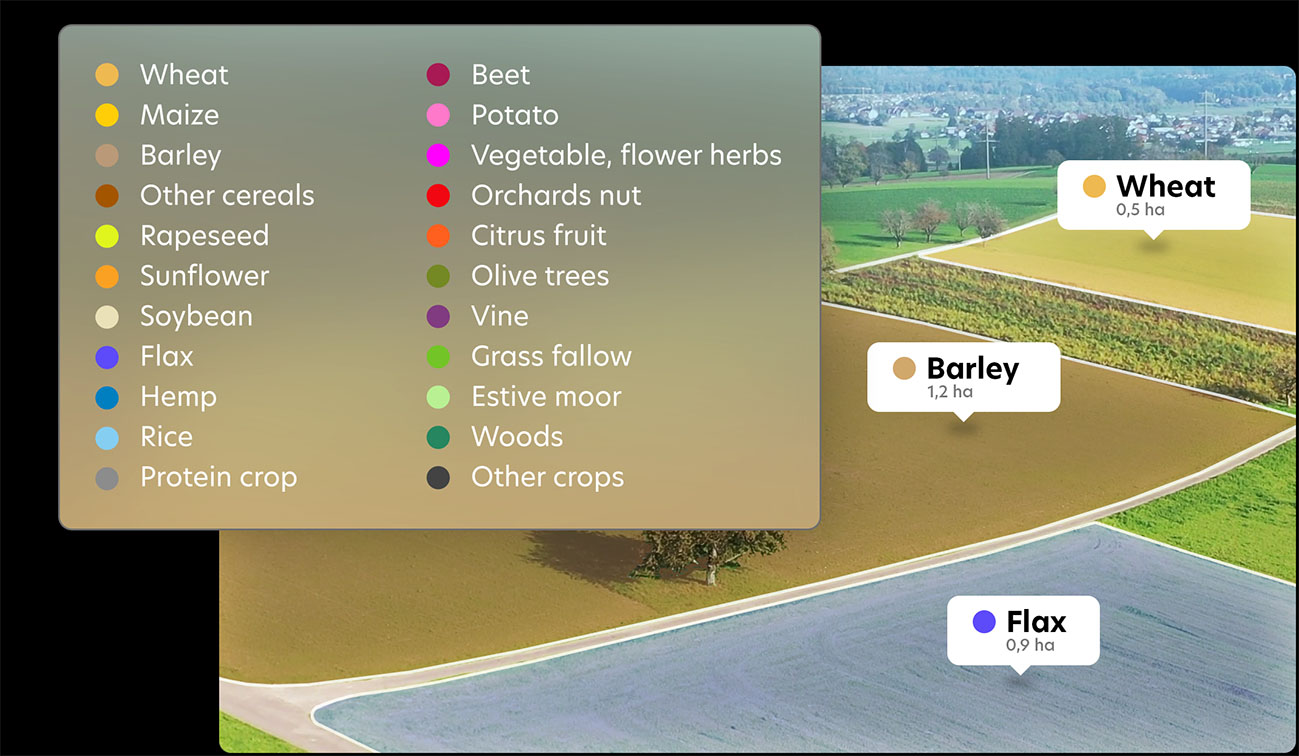
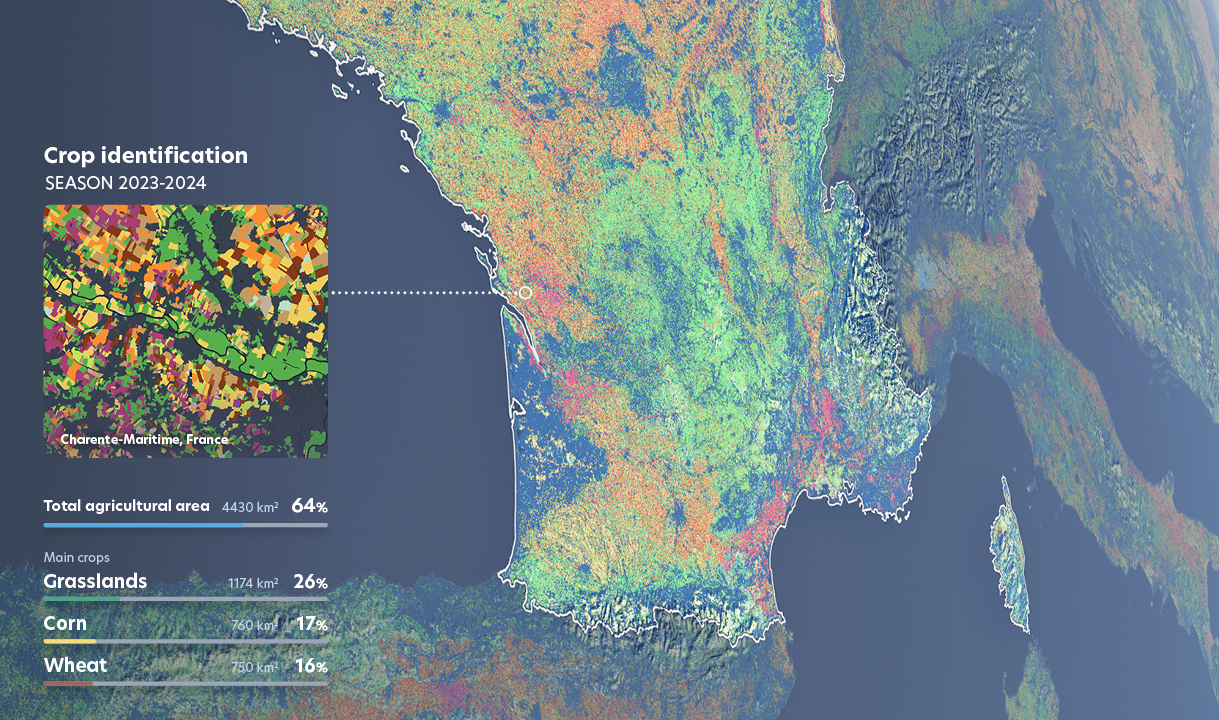
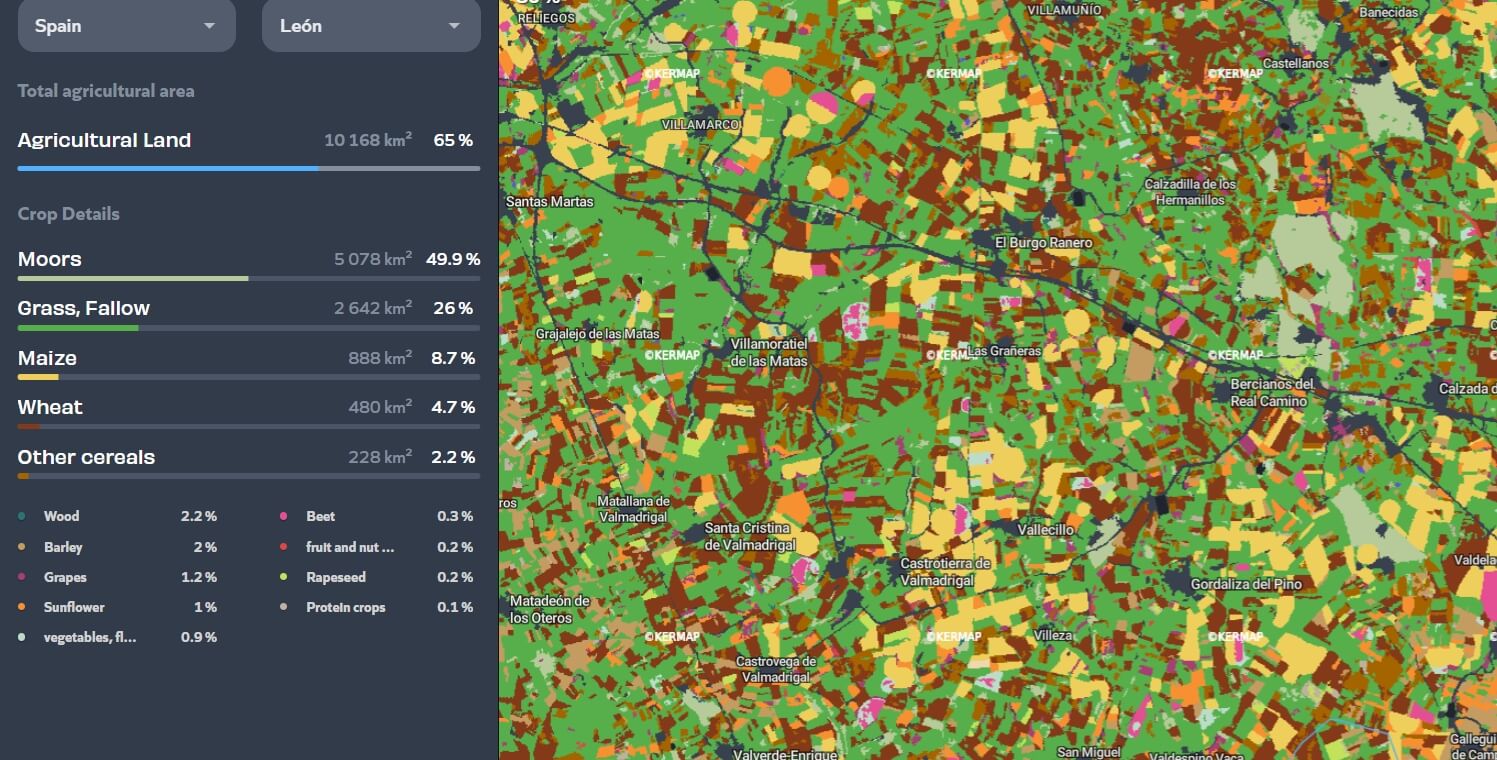
Pick any crop - we've got you covered
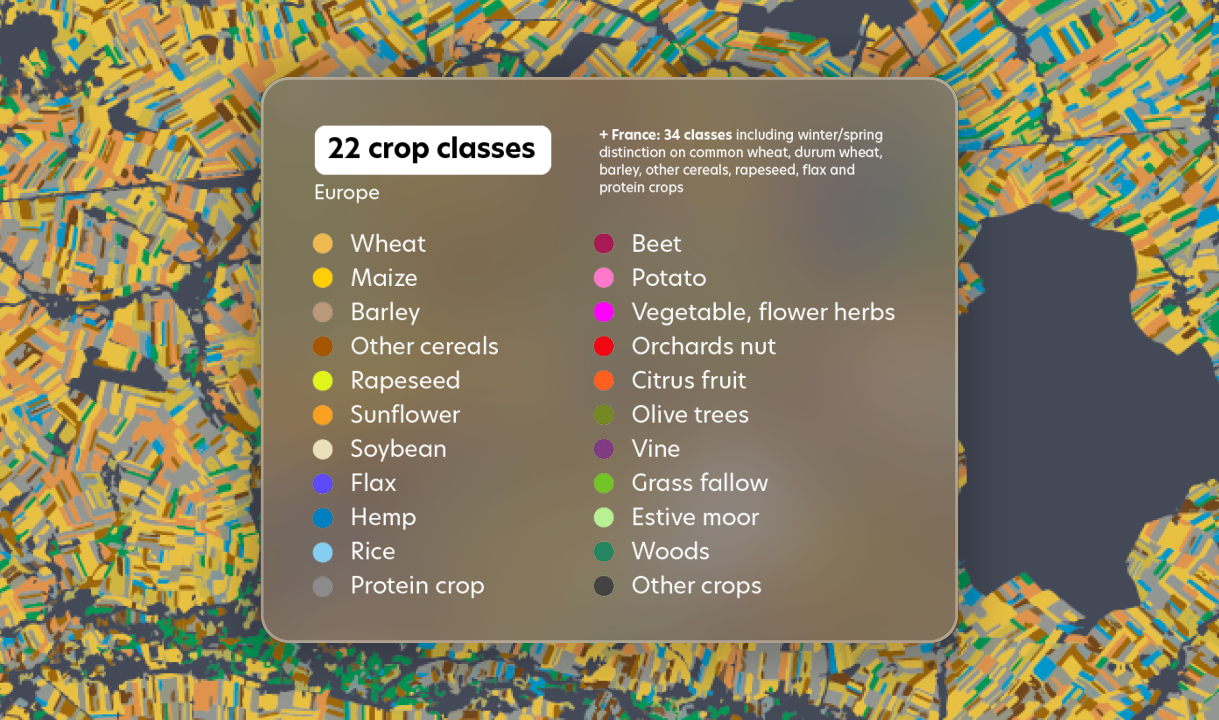
Get the data you need only on relevant crops, thanks to Nimbo’s in-house classification. The most detailed dataset out there with 22 crop classes, and up to 34 in France
Near real-time
Data automation
At scale, anywhere
API integration
Objective & reliable
Nimbo Crop ID specs
| Coverage | 28 countries available (Europe), rest of world on demand |
| Classes | 22 in Europe, 34 in France (winter/summer crops) |
| Avg. detection accuracy | 86% |
| Minimal detection area | 0.15 ha |
| Resolution | 10m/px |
| Delivery format | TIFF (pixel version), FlatGeobuff (field boundaries version) |
| Source | Sentinel-2 (Copernicus Programme) |
Accelerate with Nimbo Crop ID
Turning satellite imagery into reliable, extensive, user-ready information
FAQ on Nimbo Crop ID
Satellite crop identification : how does it work ?
To support the promotion of sustainable agriculture, Nimbo by Kermap provides the agricultural sector with satellite-based crop identification products. This information is processed rapidly and at scale thanks to artificial intelligence (AI). The resulting indicators and visualization tools help simplify crop monitoring and quantify environmental services as part of the transition to more sustainable farming practices.
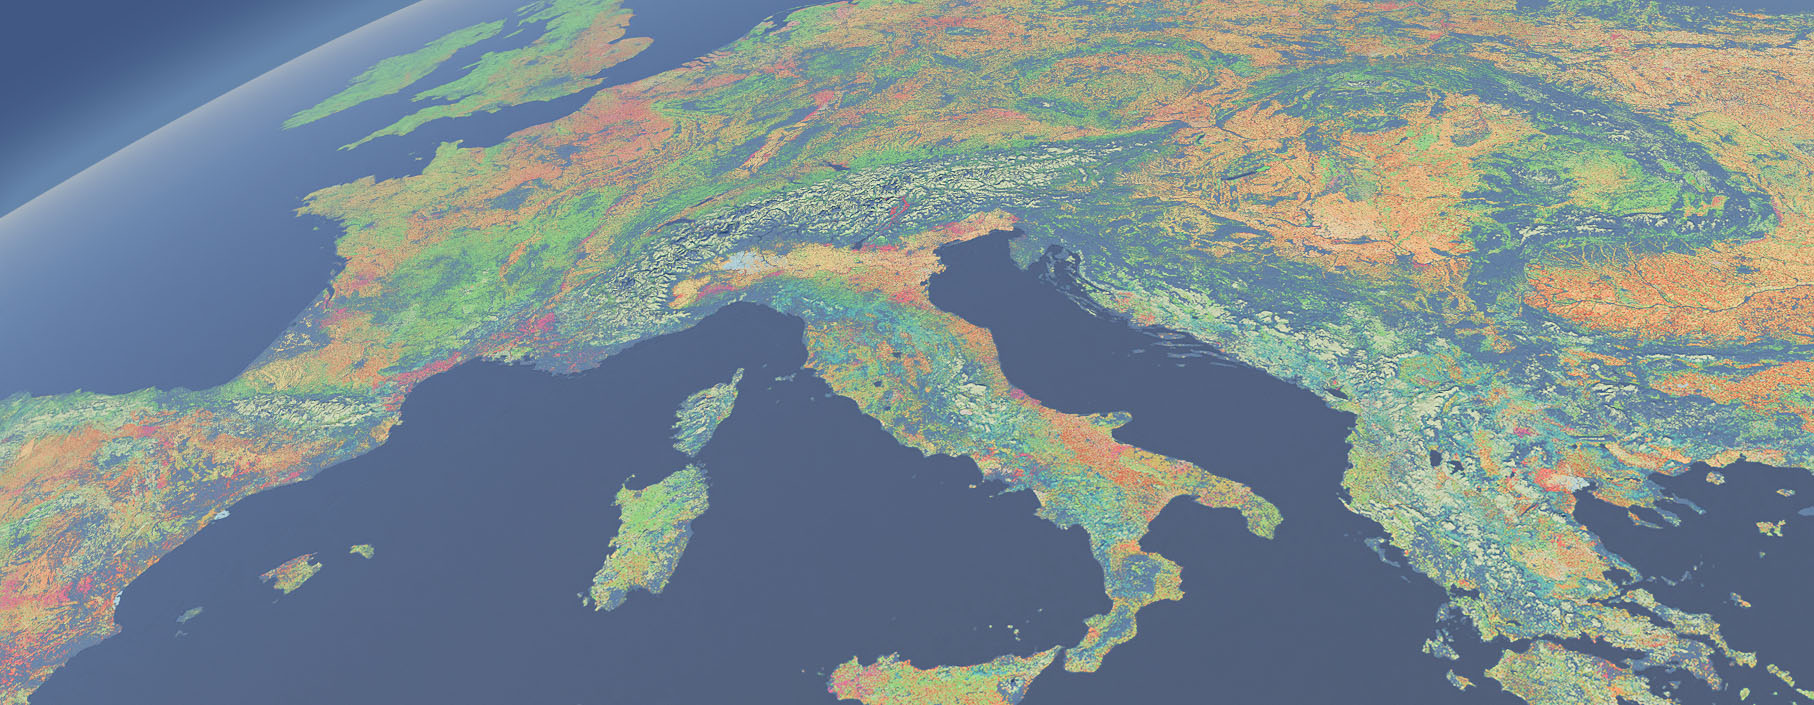
Our innovative AI models enable fast, accurate identification of crop types at parcel level using satellite imagery — regardless of territory size, from individual farms to the continental scale.
These deep learning techniques allow us to publish maps of dominant crops in France nearly a year ahead of the government's official parcel register (RPG). We also produce this information for 28 European countries — available on our Nimbo platform to monitor crop rotation patterns and anticipate future trends.
What are the uses of crop identification ?
Satellite crop identification unlocks powerful insights across agriculture, environmental monitoring, public policy, and agri-business. In farming, it supports crop monitoring, rotation tracking, and yield forecasting at scale, helping optimize inputs and improve seasonal planning.
For policymakers, remote crop detection facilitates CAP compliance checks, land use monitoring, and the design of sustainable rural policies. Environmental stakeholders use crop maps to quantify ecosystem services, assess biodiversity, and support water resource management.
In carbon and sustainability markets, crop data such as Nimbo's provides robust, spatially explicit data for MRV processes. Agri-businesses benefit through improved supply chain traceability, regional market forecasting, and climate risk assessment. Insurers and financial services leverage accurate crop data to evaluate exposure and automate claims. Across all domains, automated crop classification enables faster, more objective, and scalable decision-making — from field to continent.
What are Nimbo Crop ID's specifications ?
Nimbo's AI-driven crop detection and identification rely on the processing of thousands of Sentinel imagery time series from the Copernicus programme. Resolution is thus similar to that of the original satellite imagery source (10m/px), which is amply sufficient to perform accurate crop identification over vast territories, on parcels above 0.15 ha.
Nimbo's crop classification can be applied at pixel level, an approach that will be favored if only production areas metrics are required, e.g. how many hectares of wheat have been cultivated over a given country/region and period.
If crop information must be provided along specific geometries, especially parcels, our classification can be integrated into official datasets such as France's RPG or rolled out along our own field boundary product for maximal consistency.
What data do we use for Nimbo Crop ID ?
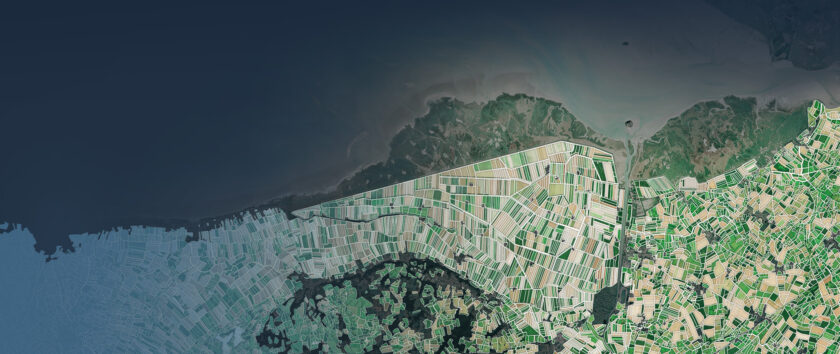
While Nimbo Earth Online offers monthly global satellite views for broad-scale visualization and historical context, Nimbo's crop identification go much deeper. It is powered by high-frequency Sentinel imagery from the Copernicus program, capturing data every 3 to 4 days. Unlike the synthetic monthly composites used in Nimbo, this denser time series enables precise, field-level analysis of crop conditions as they evolve. That means you’re not relying on static overviews—you’re accessing dynamic, actionable insights.
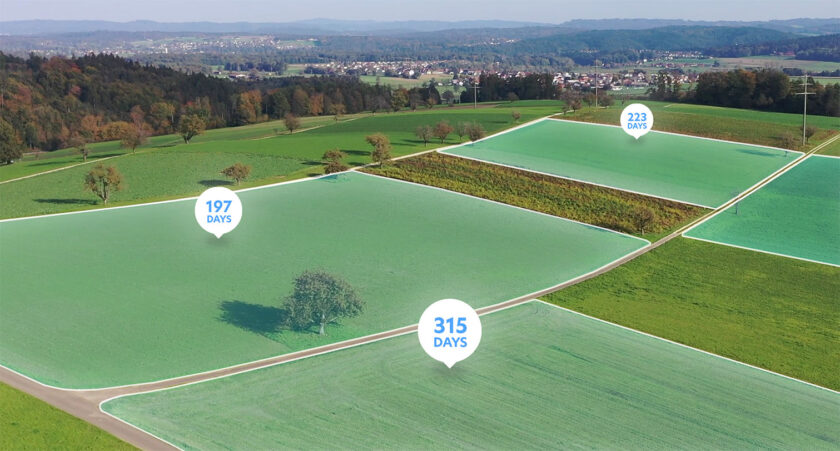
Our algorithms process this rich dataset to detect not only crop type, but also soil cover metrics (duration and quality) and other related indicators. Whether you're monitoring a region or a single field, the frequency and depth of our data make the difference. Nimbo Earth Online gives you the big picture, Nimbo's crop ID gives you the detail—early, reliable, and ready for use. Both products complement each other, but serve distinct needs. With Nimbo, you’re always working with the best data for the job.