Renewable Energy Assets
Every project, every month
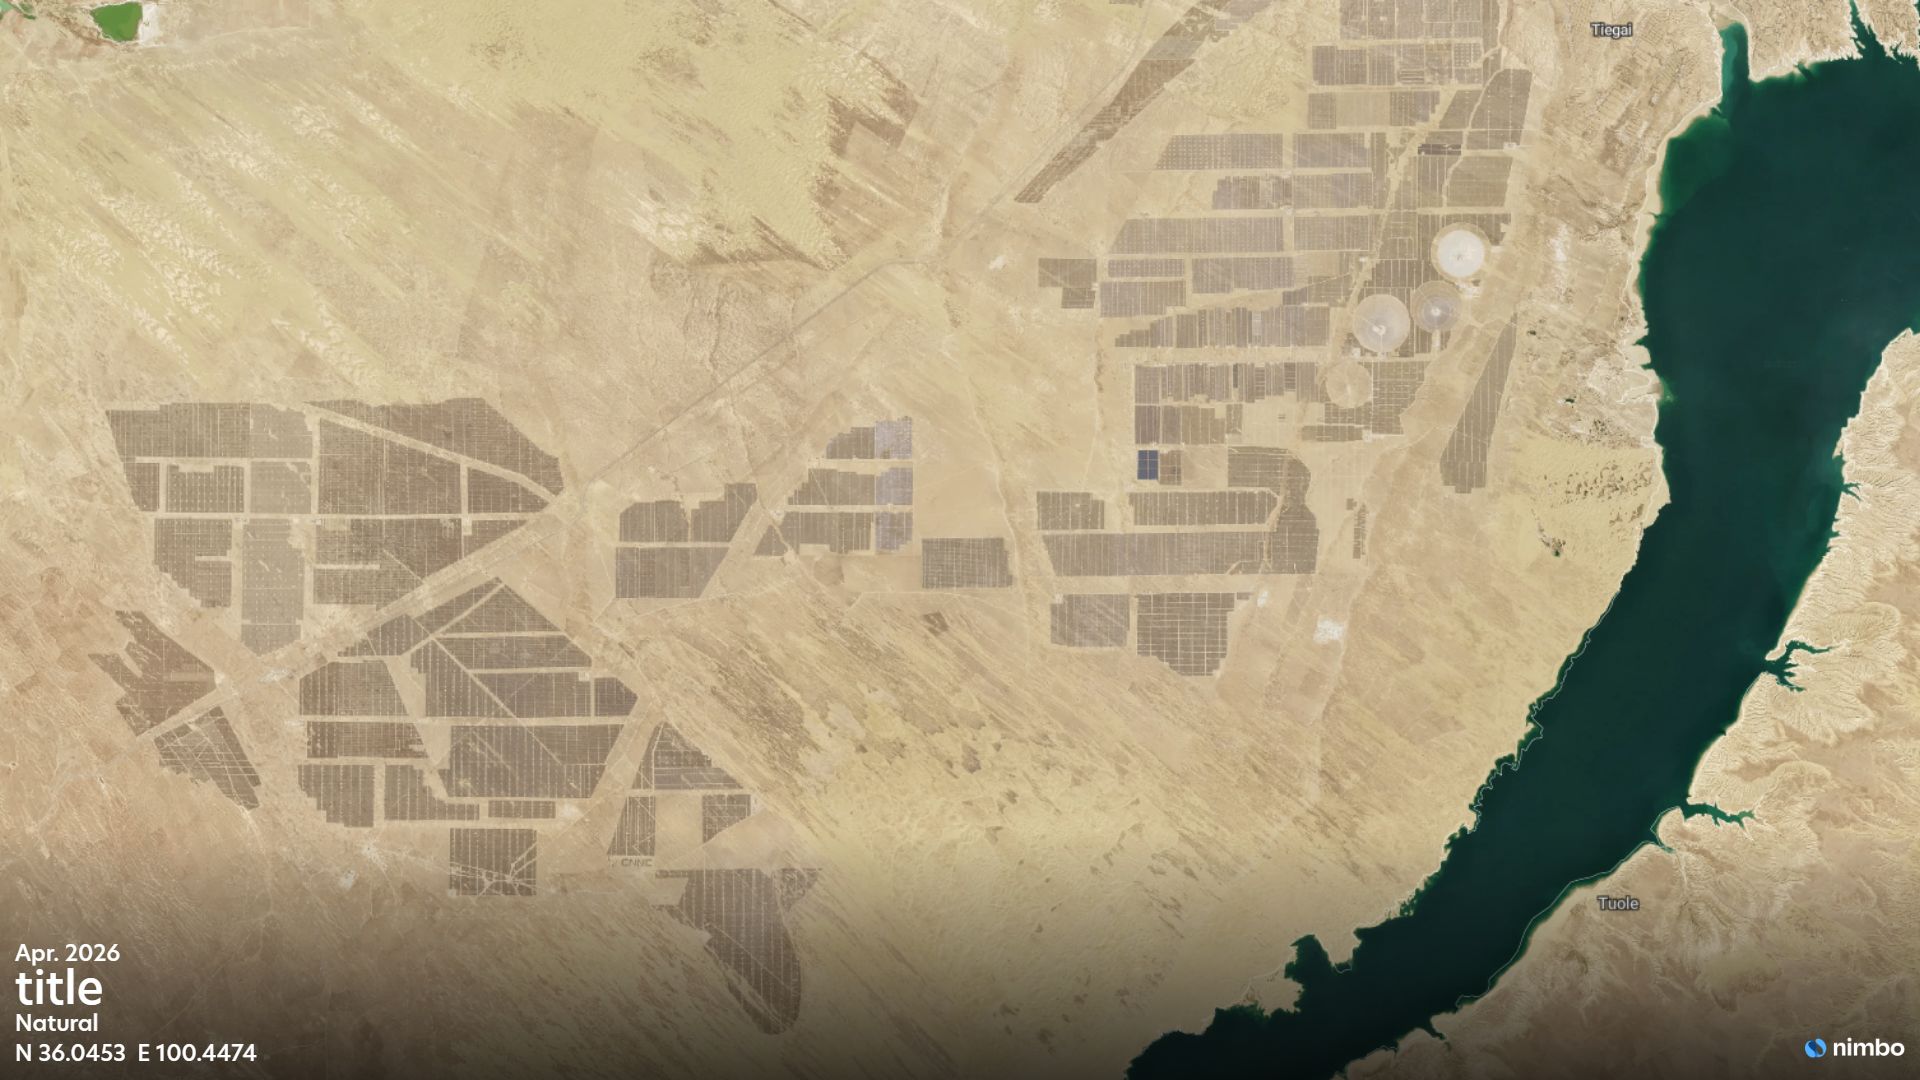
Access largely cloud-free 2.5 m resolution satellite imagery, updated monthly. Site new projects, track construction, monitor vegetation around assets, and document environmental compliance across solar, wind, and storage portfolios. Use it straight from your browser, or stream it into your existing GIS via TMS, WMTS and API.


THE CHALLENGE
Remote sites, no continuous record, missing proof
Renewable assets are built fast and spread wide, from single large sites to portfolios across regions. Yet teams have no continuous, comparable visual record to monitor them.
- Distance: Solar farms and wind sites sit far from teams, with field visits costly and infrequent.
- Tasking Costs: High-res, on-demand acquisitions incur high costs for routine, portfolio-wide checks.
- Fragmented Evidence: ESG, permitting and progress reports rely on scattered, one-off snapshots instead of a continuous record.
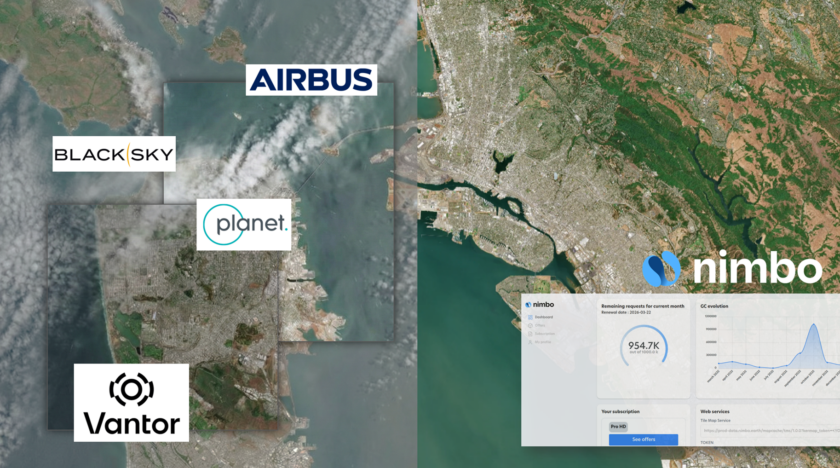
Nimbo delivers ready-to-use satellite imagery
so your team can focus on the asset, not the data pipeline.
2.5 m/px
AI-enhanced from Sentinel data. Advanced compositing minimizes cloud gaps on Enterprise plans.
Monthly basemap
Largely cloud-free, updated monthly. Pixel-level provenance preserved.
5 data layers
Natural (RGB), Infrared (NIR), NDVI updated monthly. Radar (SAR) and LAI available on Enterprise plans.
Terrain & elevation
Global DEM, 2 m to 30 m resolution. Aligned with Nimbo imagery — ready for slope, viewshed and 3D site analysis.
Site Selection & Development
Plan and prospect new sites
Developers and EPCs use Nimbo to screen and validate sites before committing to ground surveys.
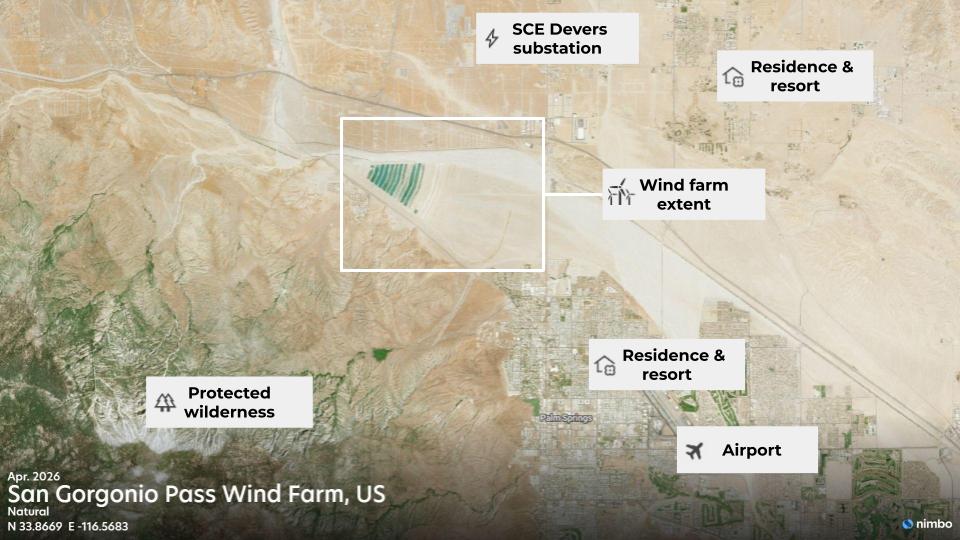
- Land Assessment: Evaluate terrain, existing land cover and access routes with recent imagery and elevation data.
- Environmental & Site Context: Assess the surroundings before committing, including residential areas, farmland, water bodies and protected zones, to gauge impact, community acceptance and permitting constraints early.
- Baseline Record: Capture pre-construction site conditions for permitting and environmental impact files.
Imagery shows the surface. Terrain shows the shape.
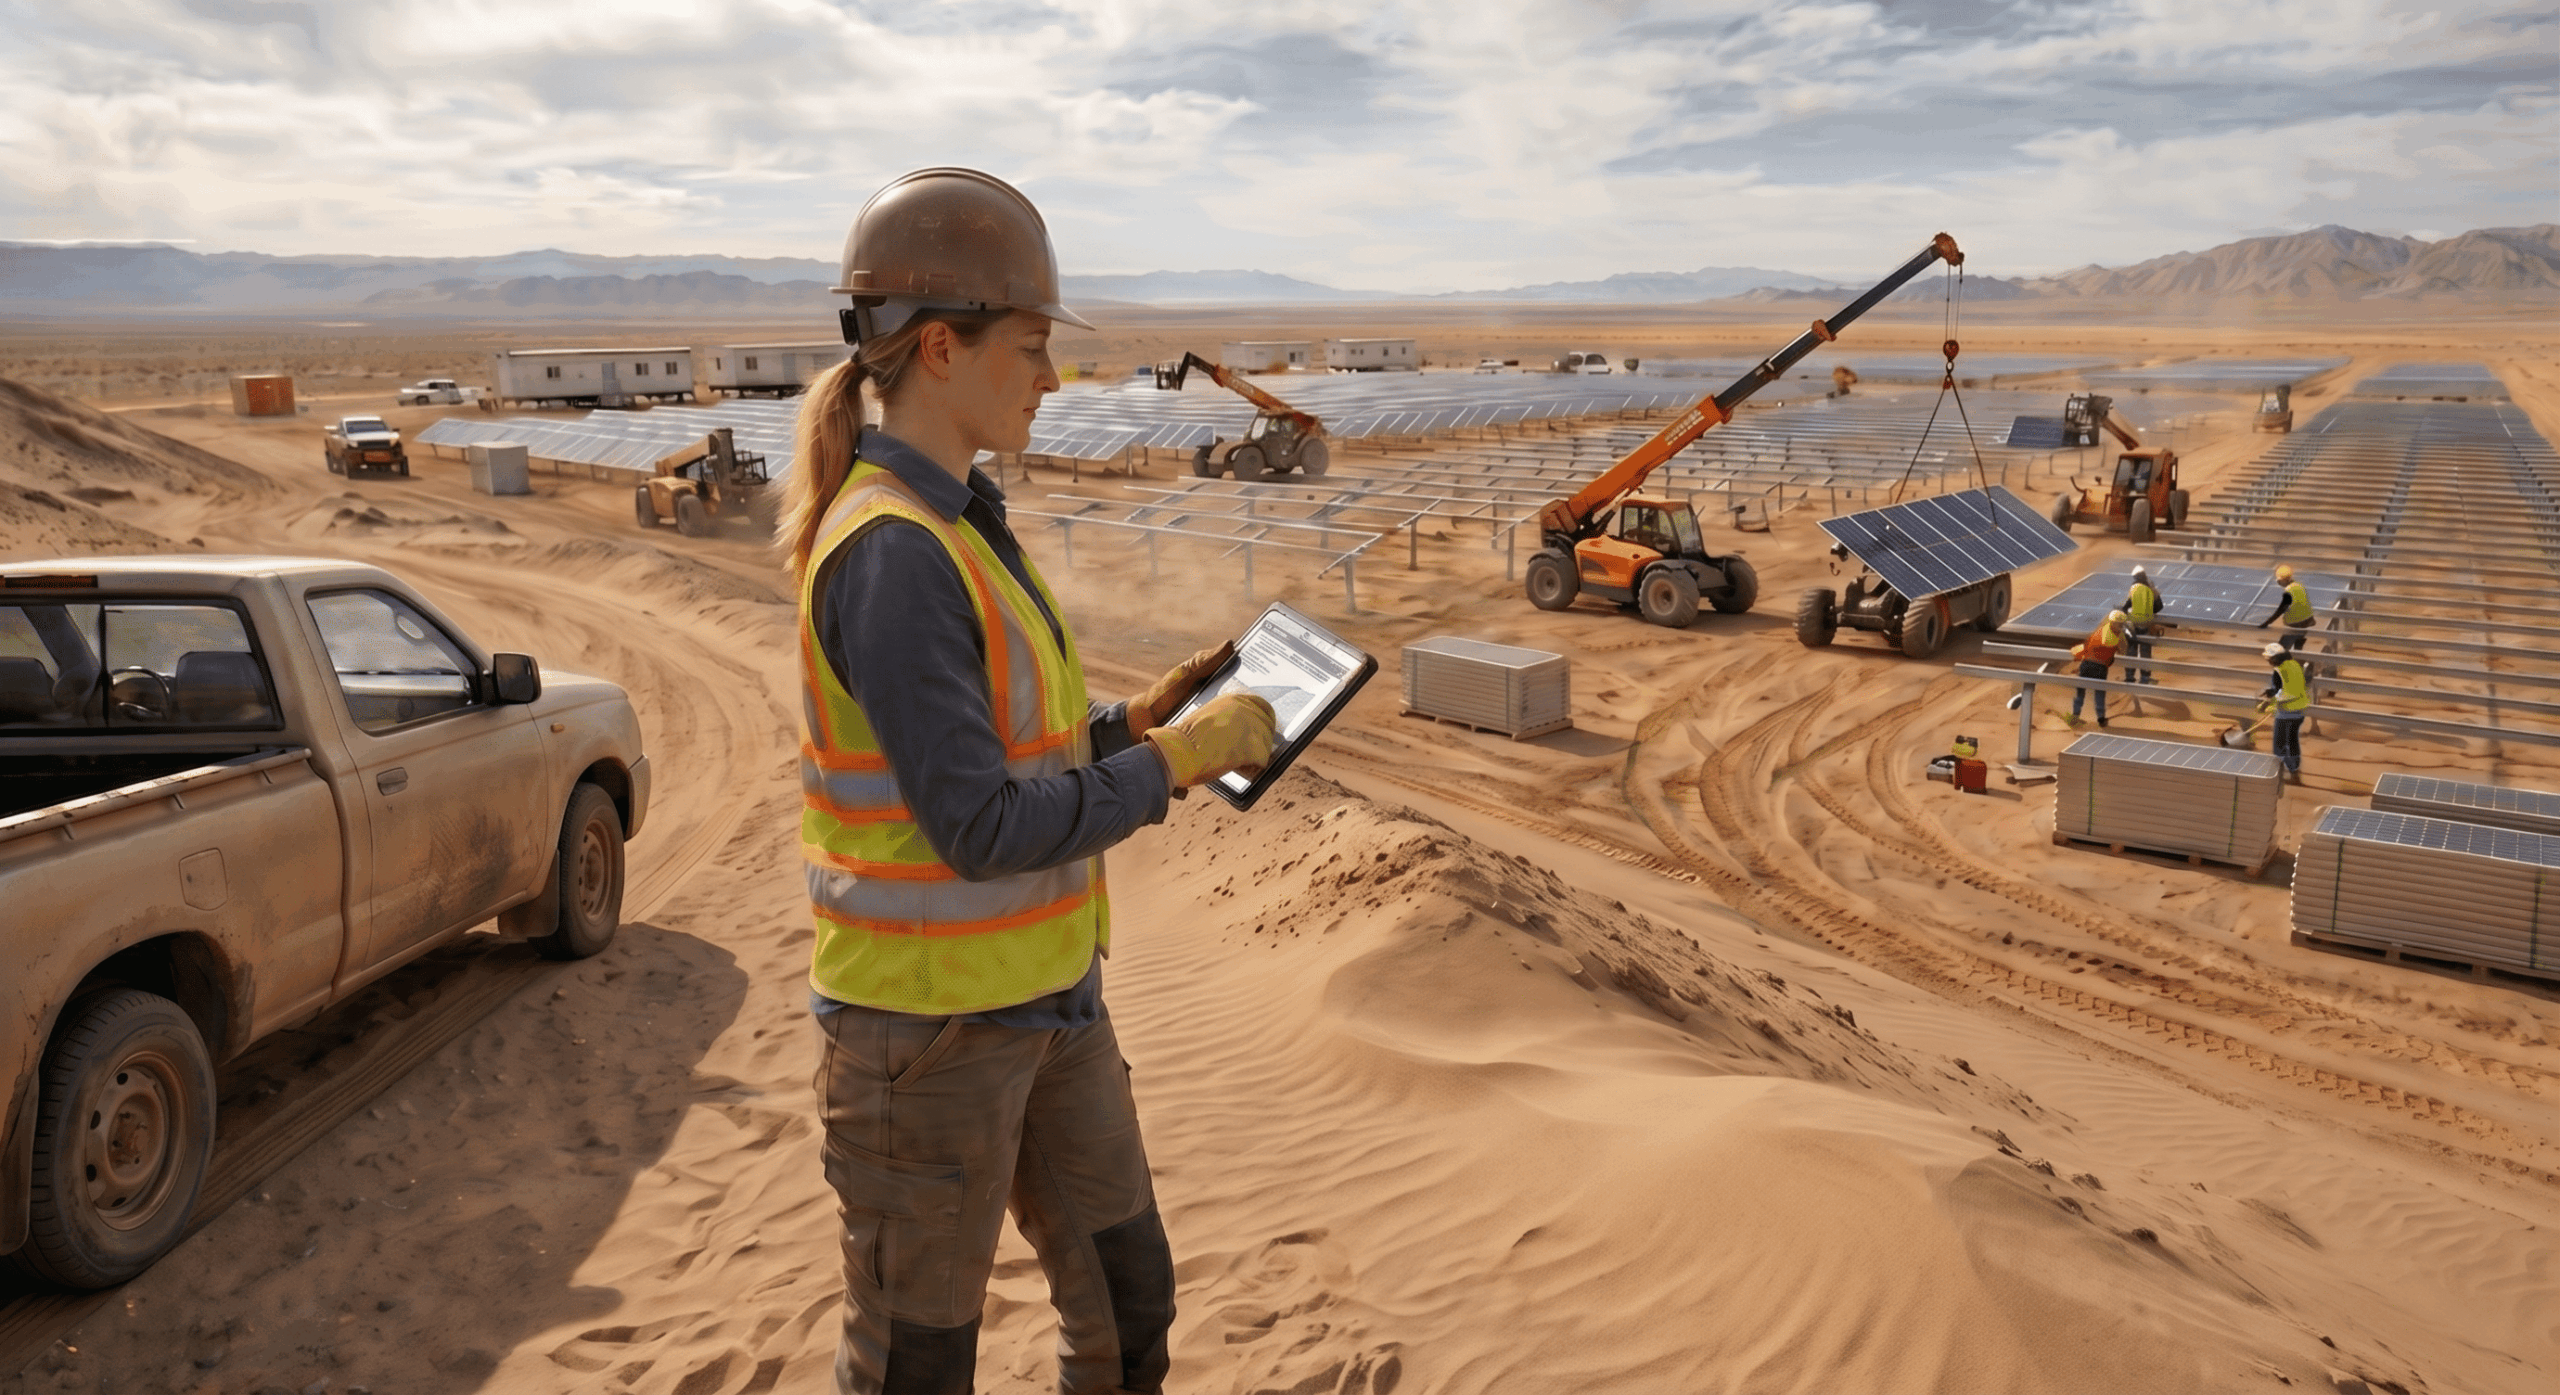
Construction & Asset Tracking
Monitor build-out remotely
Reduce site visits and tasked acquisitions with monthly basemaps across every project.
- Progress Tracking: Follow panel installation, turbine foundations and erection, battery container deployment, access roads and substation build-out month by month.
- Schedule Verification: Compare reported construction progress against satellite evidence.
- Portfolio View: Track multiple sites on one consistent, comparable basemap.
Vegetation & Site Integrity
Watch vegetation and encroachment
Maintain a monthly visual record around operating assets to manage risk and access.
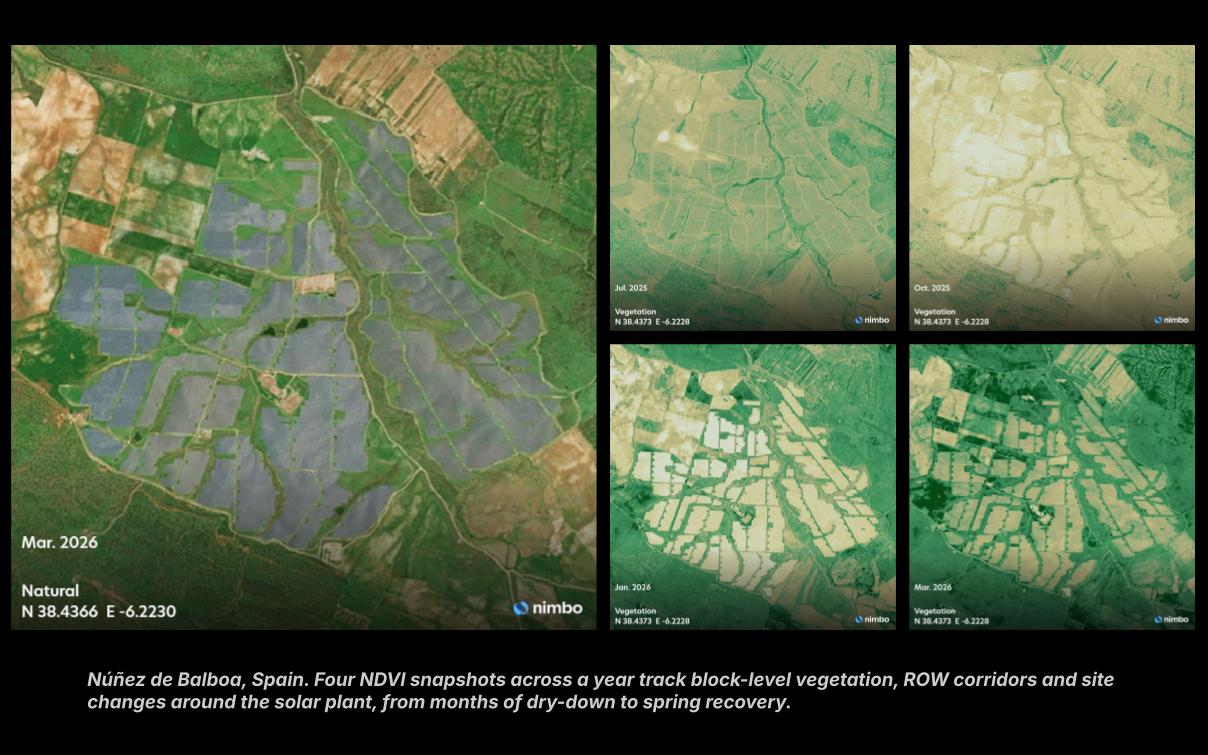
- Vegetation Growth: RGB and NDVI time series track vegetation trends across blocks, ROW corridors and access tracks, highlighting where crews should focus.
- Right-of-Way: Track clearance along transmission corridors and service roads.
- Site Changes: Detect erosion, water pooling and unauthorized activity near the perimeter.
Environmental Compliance & ESG
ESG and compliance evidence
Build a continuous record of environmental performance to support CSRD, TNFD and lender ESG requirements.
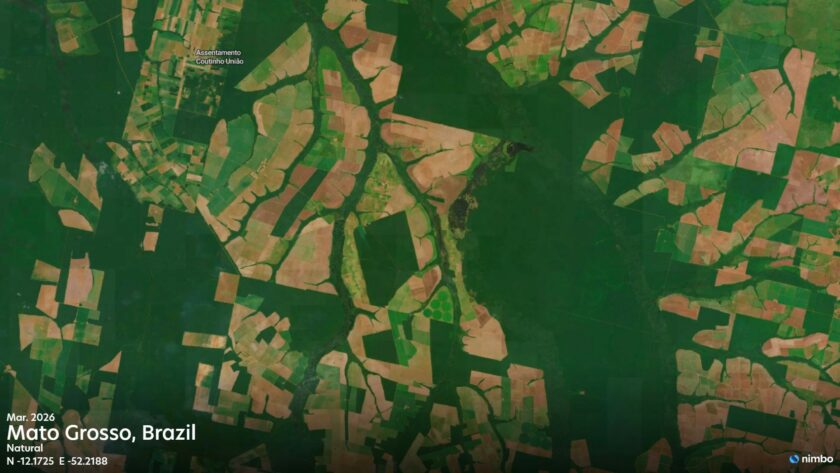
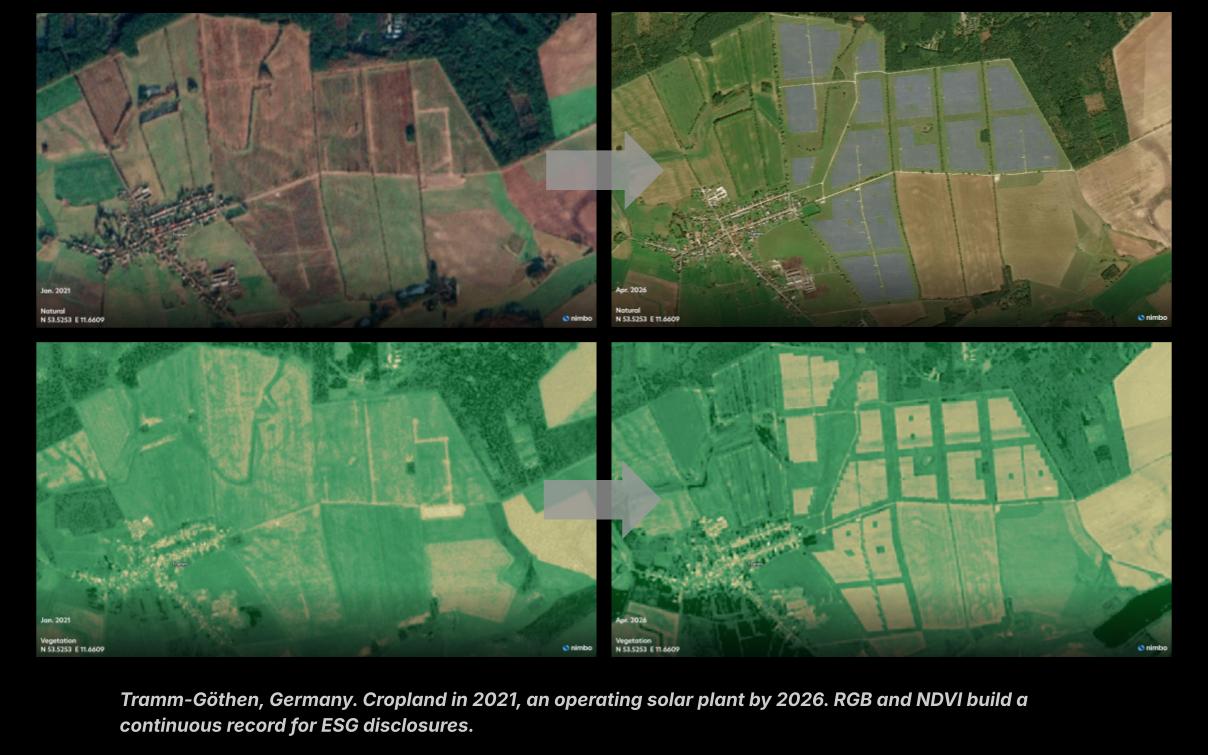
- Land-Use Change: Combine natural color (RGB) with NDVI to document land cover before, during and after development.
- Habitat & Buffer Zones: Watch for impact near protected areas, wetlands and Key Biodiversity Areas (KBAs).
- Restoration Tracking: Document revegetation and site rehabilitation around decommissioned or repowered assets.
A monthly view of every asset that matters to you
Whether you develop, operate, finance or regulate renewable infrastructure, you need up-to-date, comparable and traceable evidence. Nimbo delivers it monthly, without tasking costs.