

Europe just got a reminder of why the renewable energy build-out matters. On July 2, 2026, the European Environment Agency (EEA) reported that gas price spikes cost the EU an extra €13 billion by mid-April this year, while renewable electricity saved the bloc roughly €29 billion over the same period. The agency’s conclusion was direct: scaling up wind and solar is now the EU’s clearest defence against volatile fossil fuel markets, potentially cutting import dependence and heading off a 125% rise in wholesale prices by 2030.
That’s a strong case for building faster, and the build-out is already well underway. According to Eurostat, renewable sources generated 45.5% of the EU’s electricity in the first quarter of 2026, up from 42.7% a year earlier. The direction of travel is clear, and the pace is accelerating.
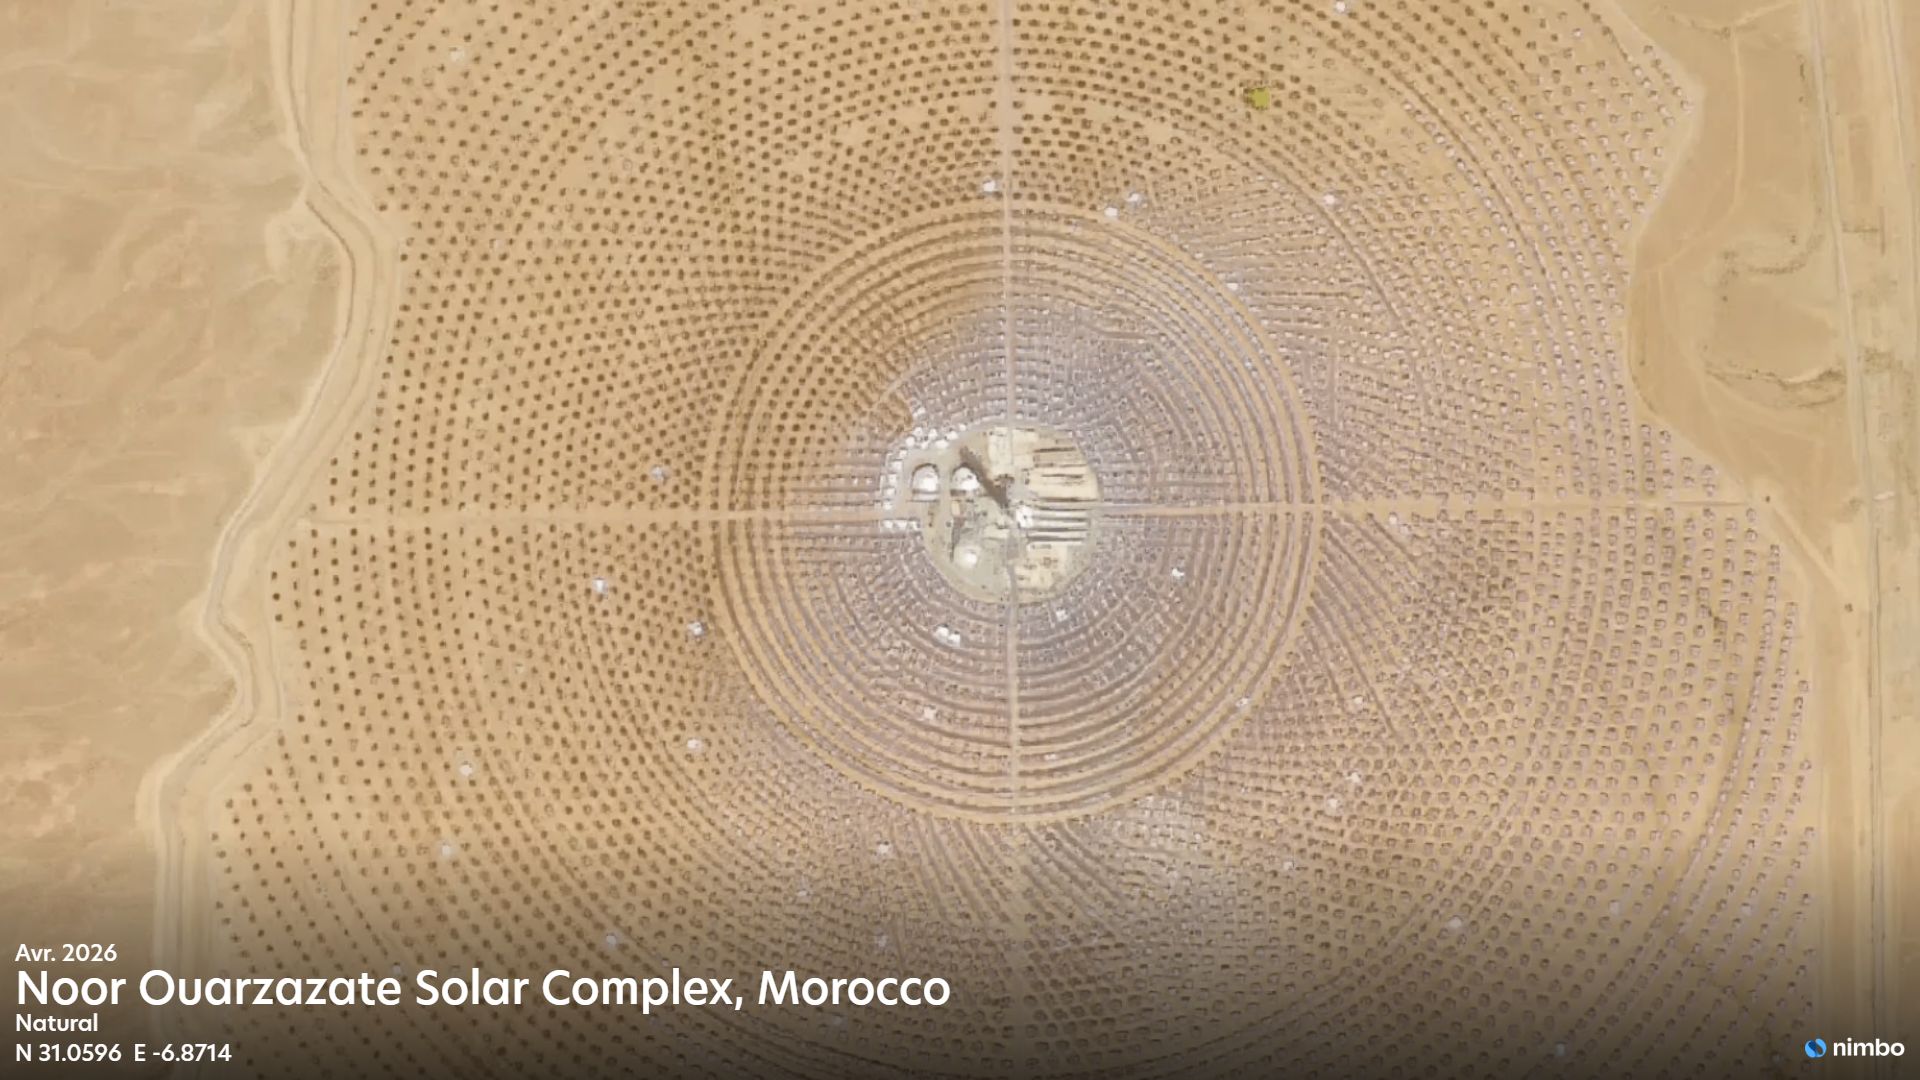
If renewables are set to carry a growing share of Europe’s energy mix, one thing follows directly: the number of the projects on the ground is going to keep rising, spreading from single large sites to portfolios spanning multiple regions, and across very different asset types: Eurostat puts wind first at 44.9%, ahead of hydro at 28% and solar at 17.3%, across very different terrain and footprints. At that scale, keeping clear, current imagery of every site, its build-out, the vegetation around it, its environmental performance, becomes a genuine operational task in its own right. It shifts from something a team checks occasionally to something that benefits from a steady, comparable record.
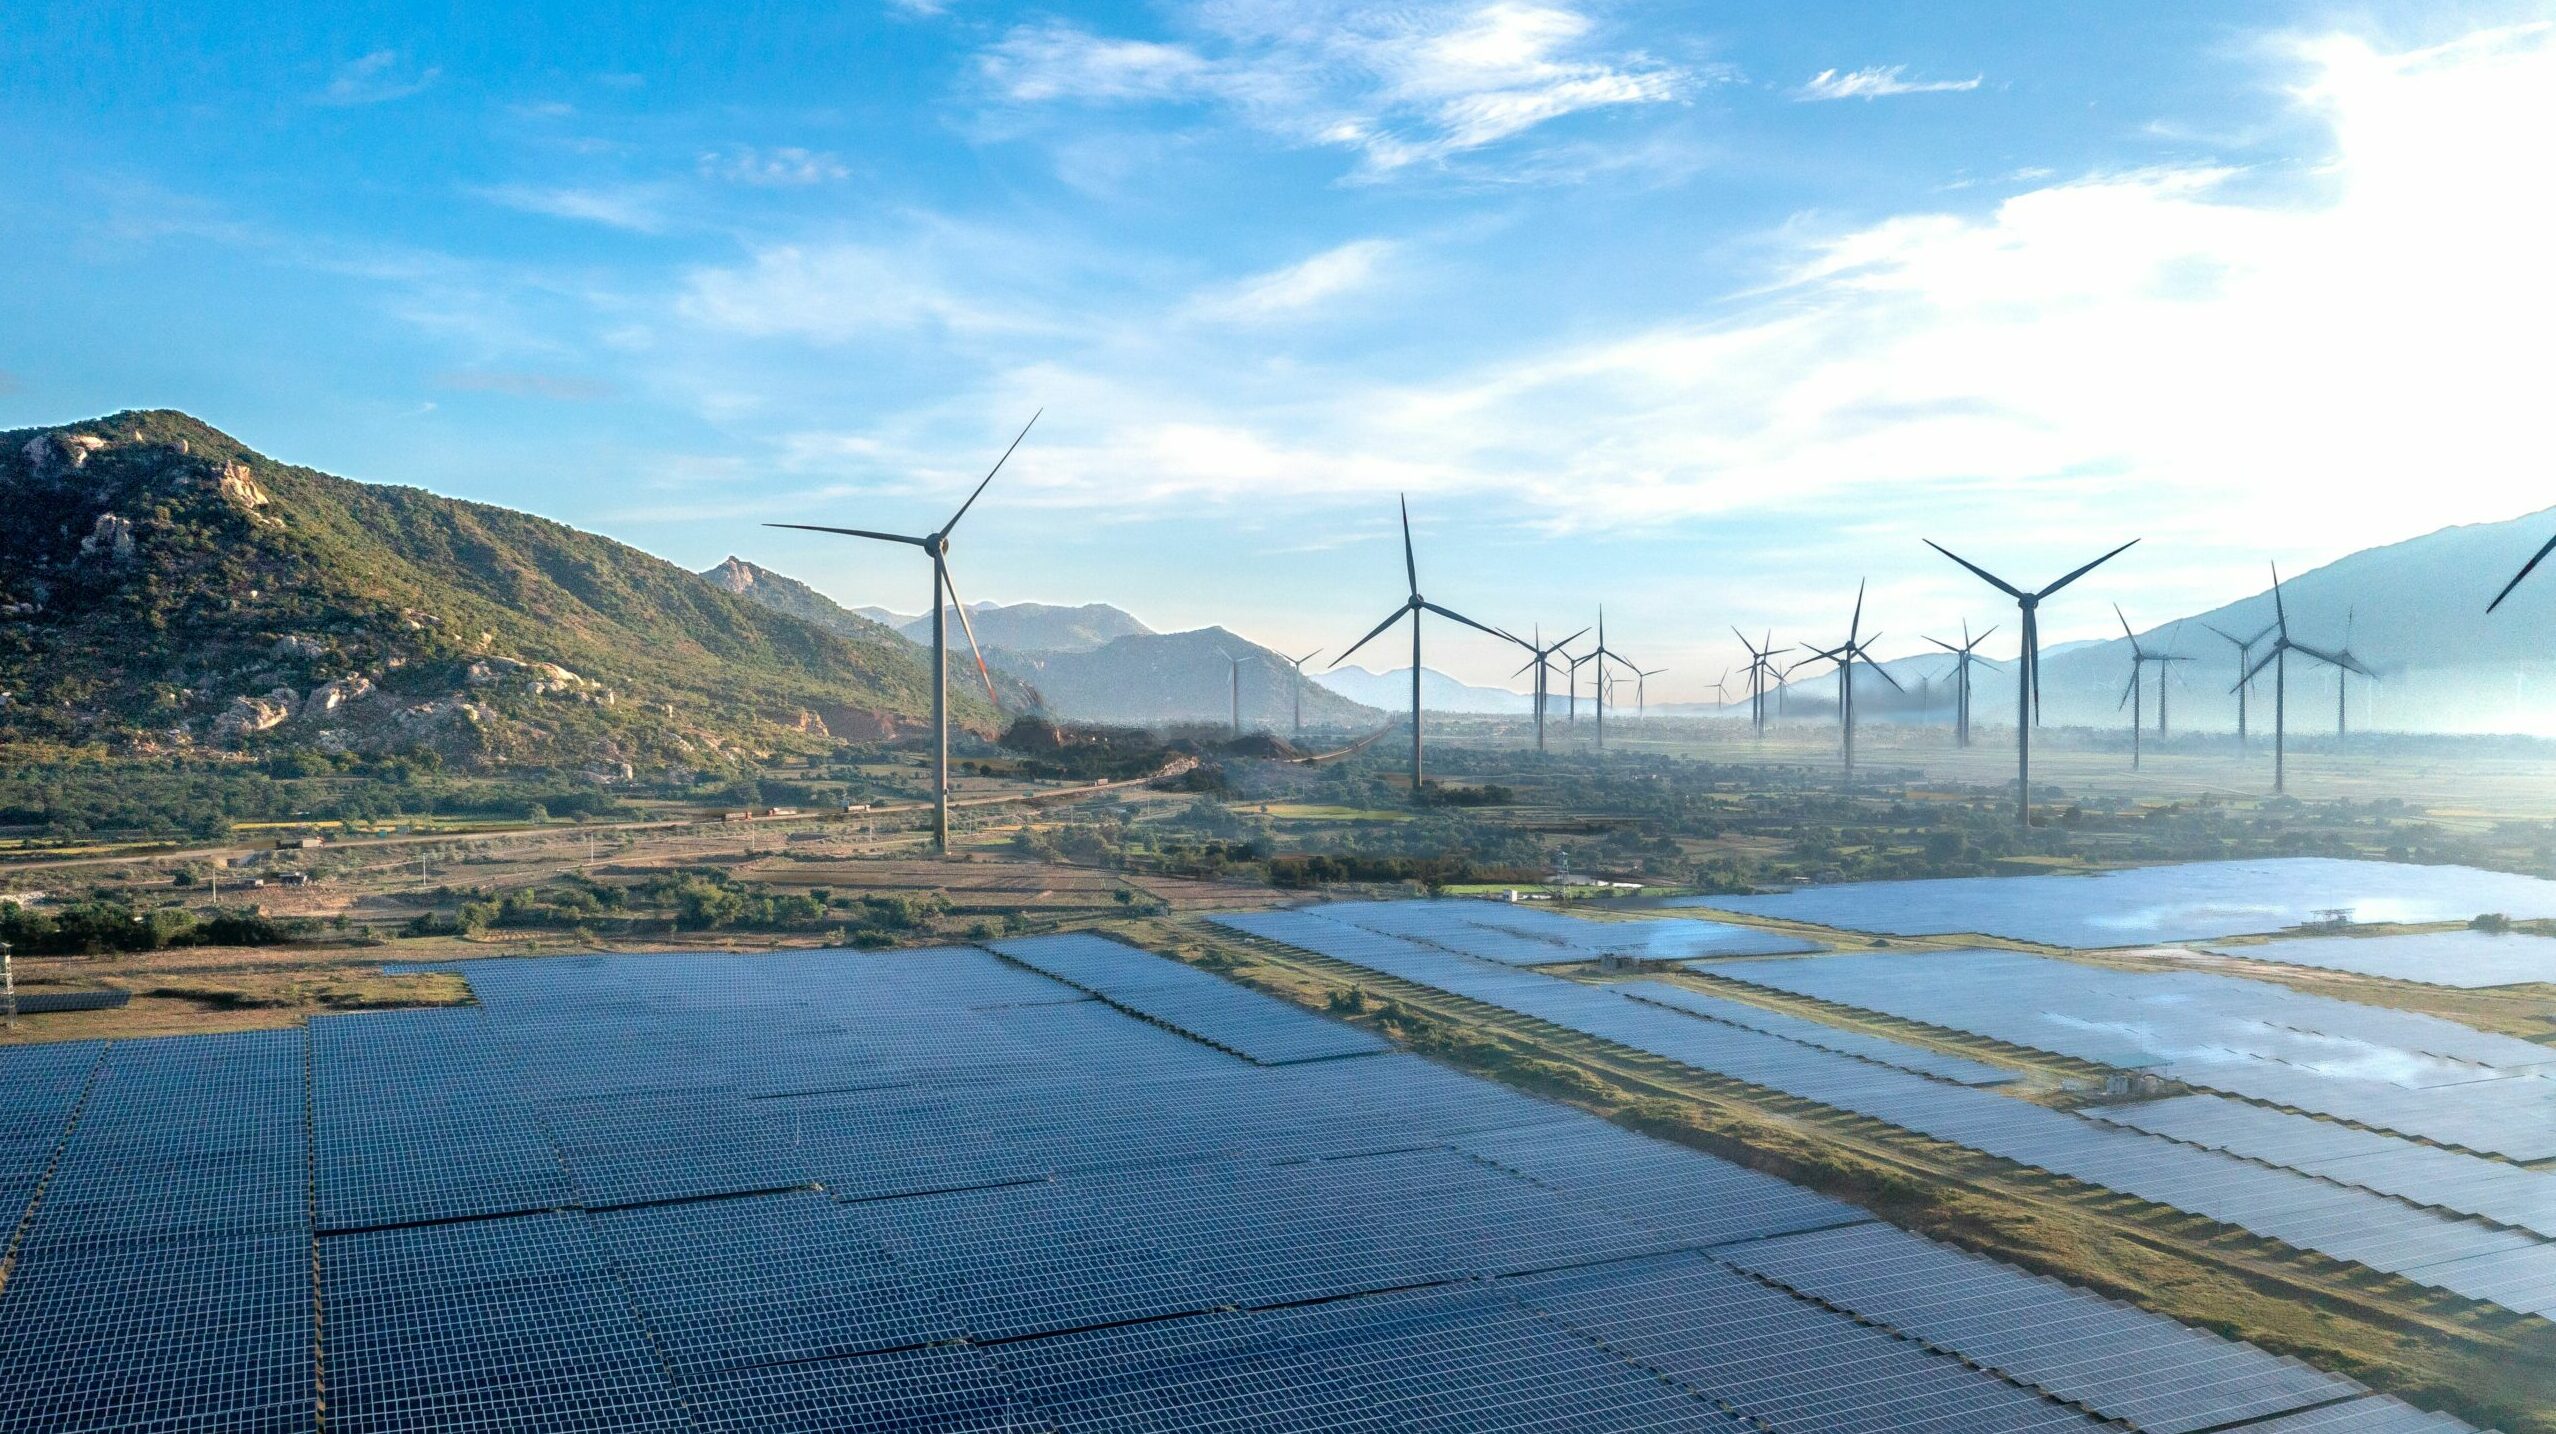
Why site-level monitoring is becoming standard
A few things are pushing continuous monitoring from “nice to have” toward “expected.” Sites are multiplying and spreading geographically, so field visits alone can’t keep up. Assets now operate for decades, far longer than a single pre-construction survey can speak to. And nature-related disclosure frameworks increasingly ask companies to report on land-use change specifically, not just emissions avoided, which rewards those who can show a documented site footprint over time.
What continuous satellite monitoring looks like in practice
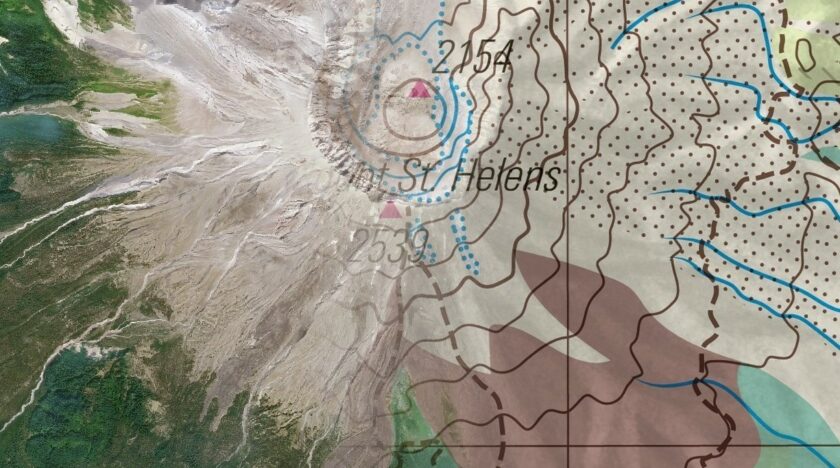
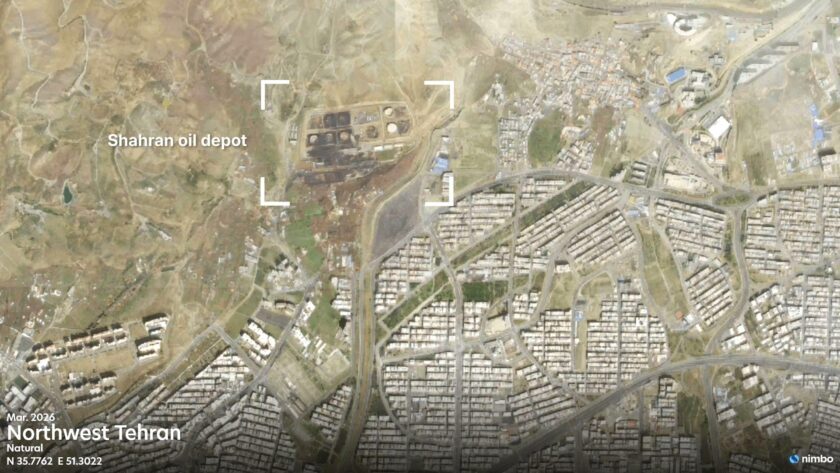
This is where satellite Earth observation earns its place, not as a one-time compliance checkbox, but as a running record. Nimbo, built by Kermap, processes Copernicus Sentinel data into largely cloud-free, AI-enhanced 2.5m global basemaps refreshed every month, with an archive reaching back to 2019 in Europe and 2023 worldwide. For a renewable energy site, that means a basemap exists for practically every month since before most current projects broke ground. In practice, that plays out across the full life of an asset:
- Site selection: Before committing to ground surveys, developers can screen a candidate site using recent imagery and elevation data, assessing terrain, existing land cover, access routes, and the surrounding context of residential areas, farmland, water bodies, and protected zones. It also captures a clean pre-construction baseline for permitting and environmental files.
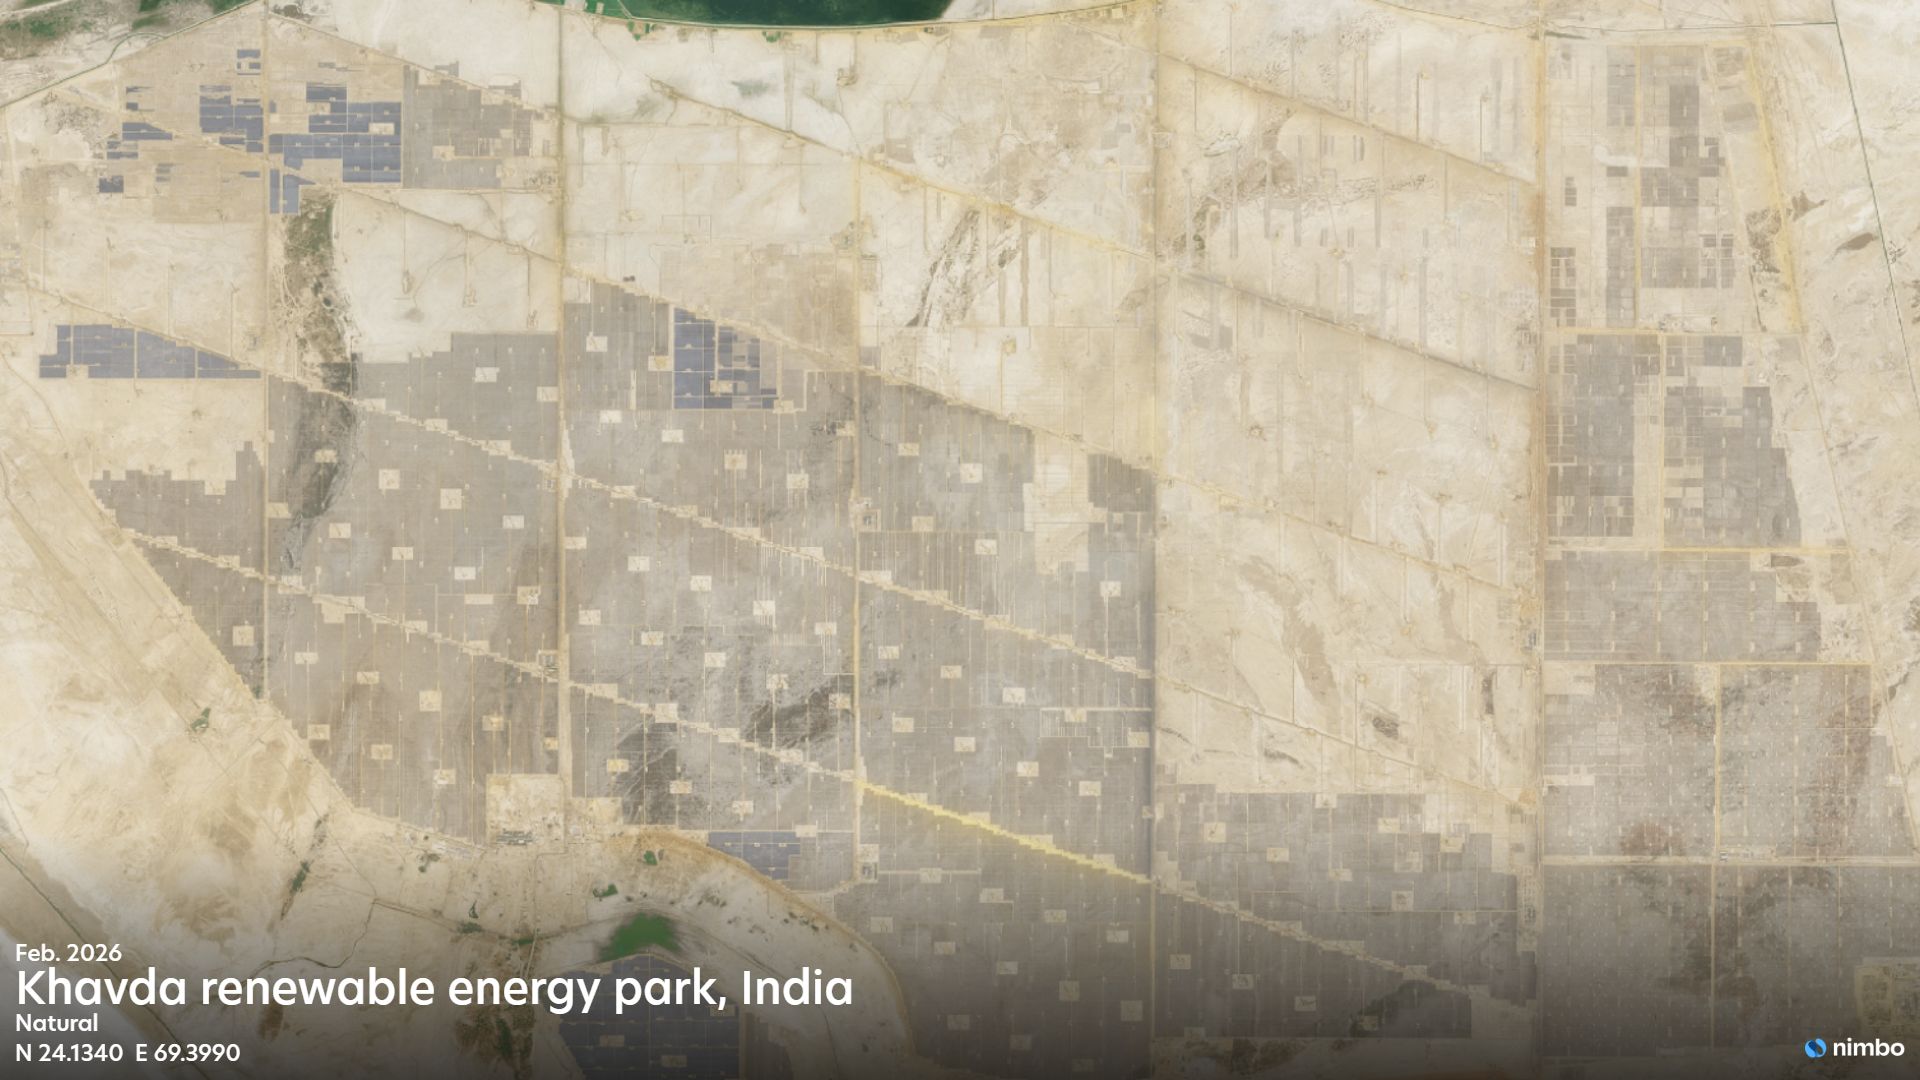
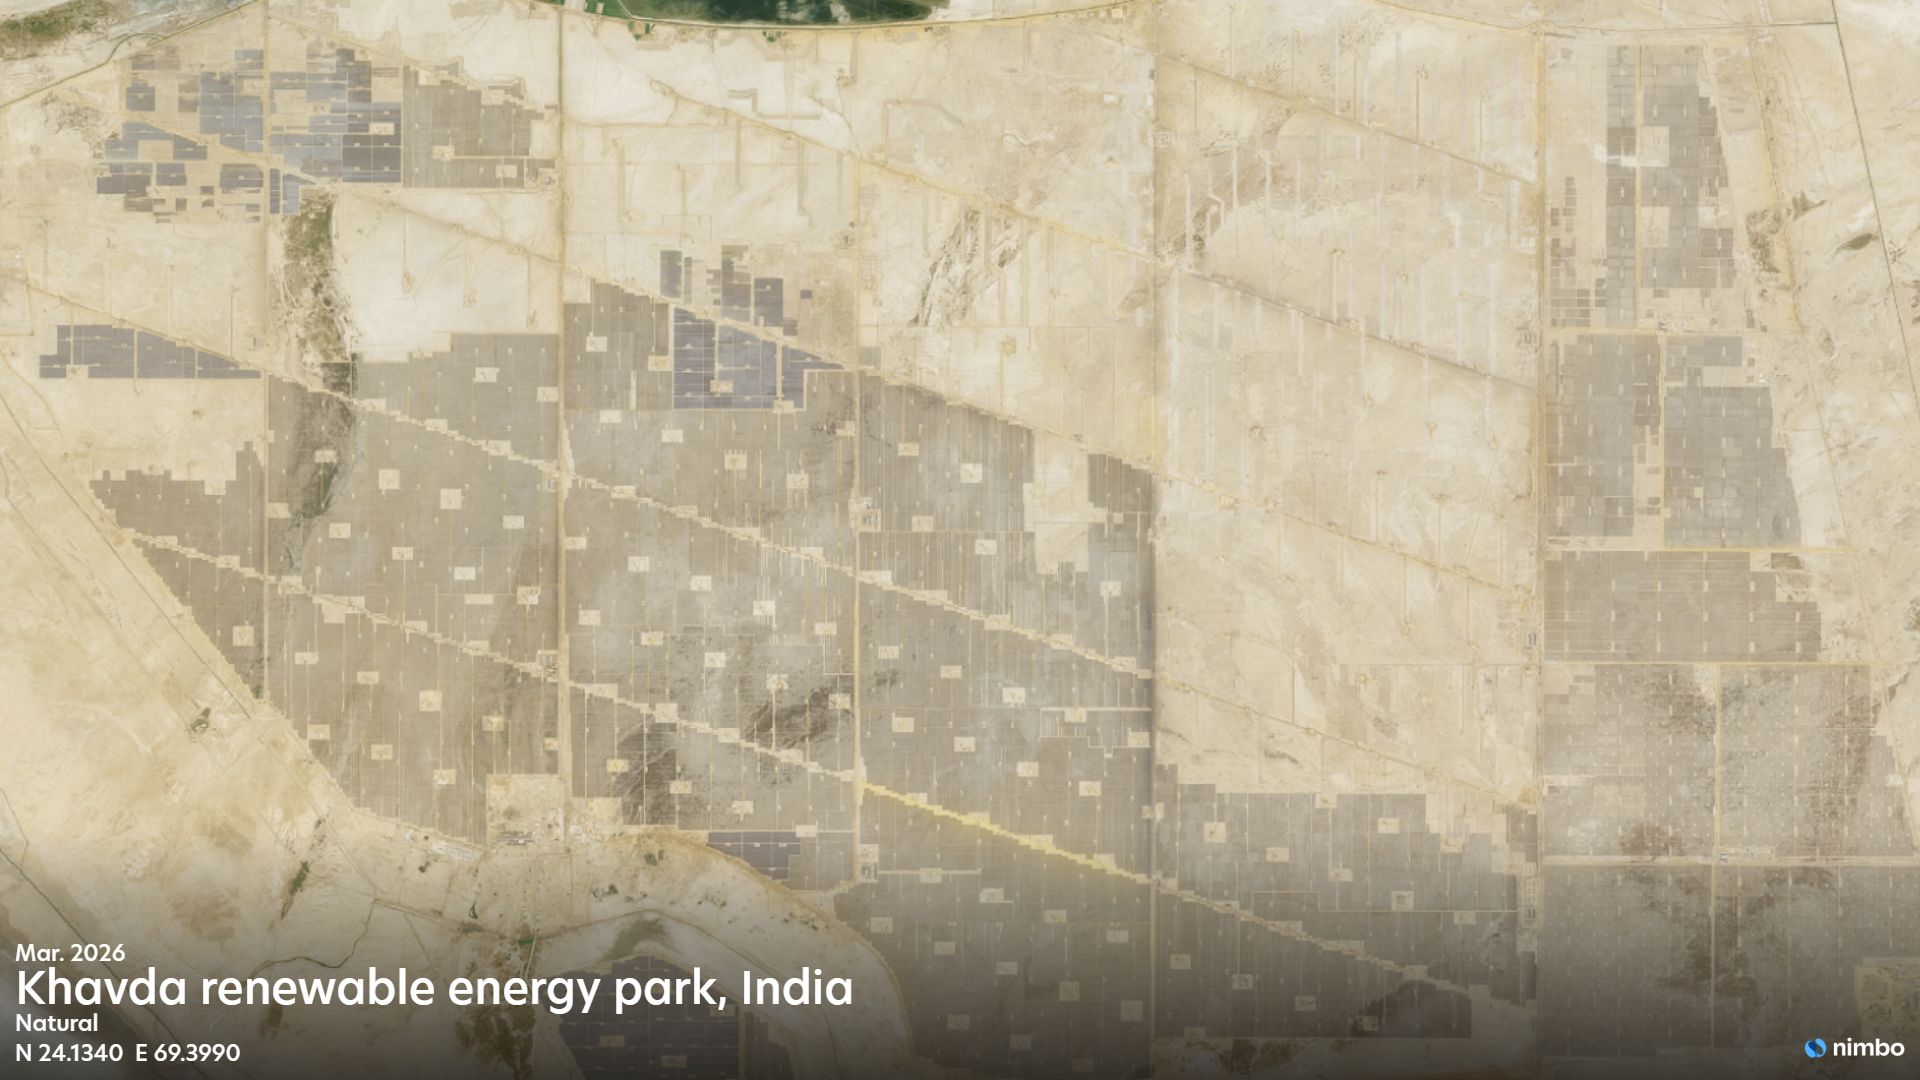
- Construction tracking: Once building starts, Nimbo’s monthly basemaps let teams follow panel installation, turbine foundations, battery container deployment, access roads, and substation build-out month by month, and compare reported progress against what the imagery actually shows, all without repeated site visits or tasked acquisitions.
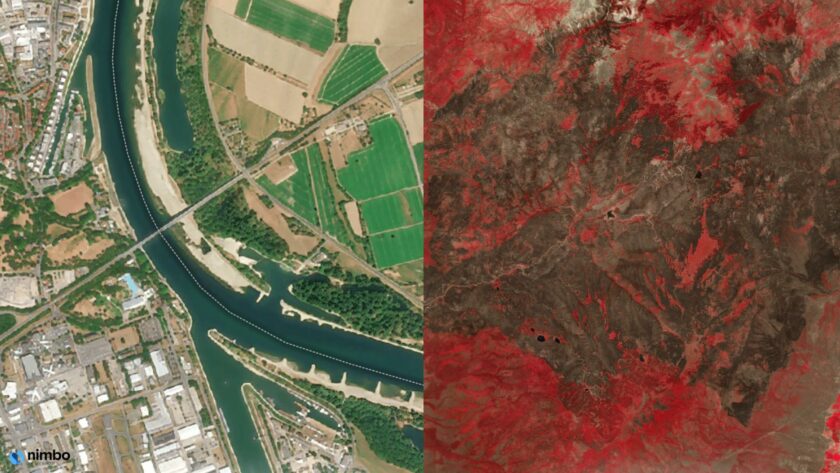
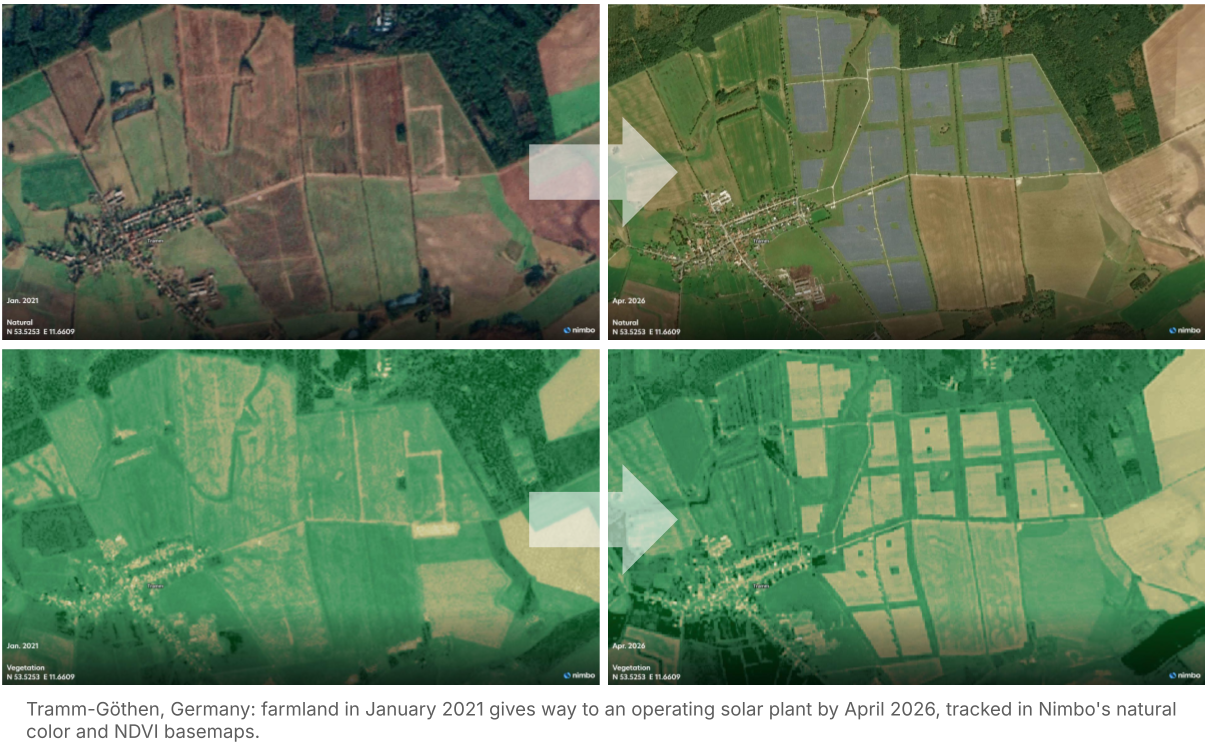
- Vegetation and site integrity: Around operating assets, natural colour (RGB) and NDVI layers track vegetation trends along blocks, right-of-way corridors, and access tracks, flagging where maintenance crews should focus. The same record helps detect erosion, water pooling, or unauthorised activity near a site perimeter.
- Environmental compliance: Combining natural colour and NDVI documents land-cover change before, during, and after development, useful for CSRD, TNFD, and lender ESG requirements. It also supports watching for impact near wetlands and Key Biodiversity Areas, and documenting revegetation around decommissioned or repowered sites.
The common thread: because the imagery refreshes every month with no per-request tasking cost, this isn’t a one-off study commissioned when a question arises. It’s a standing, comparable record that teams can return to whenever they need it.
Reframing the question
The case for building renewables is largely settled: the EEA’s own numbers make that case. What’s less settled, especially for the lenders, ESG teams, and regulators tied to these assets for decades, is a quieter question: years after a project is built, is it still keeping the environmental promises it made to get approved?
Continuous, monthly satellite imagery won’t answer every part of that question. But it replaces one-off snapshots with a steady, comparable record, so that “what’s happening on the ground” is something you can show, not just state.
See how Nimbo supports renewable energy monitoring across the full asset lifecycle → Explore Nimbo for renewable energy assets
Sources:
- European Environment Agency, “Renewables lower energy prices and play key role to reduce vulnerability to fossil fuel supply shocks,” July 2, 2026
- Eurostat, “46% of EU’s electricity came from renewables in Q1 2026” (net electricity generation, Q1 2026), July 1, 2026