

A glacier outline may look precise on a map. But does it still match what is on the ground?
For Aline Wildberger, a cartographer and GIS specialist, answering that question is part of preparing updates to the Swiss World Atlas. She is a member of the atlas’s editorial team at the Institute of Cartography and Geoinformation at ETH Zurich.
The atlas supports geography teaching in secondary education. Behind its maps, the team combines graphic design, cartographic interpretation and geospatial data processing. Aline works across these activities, with a particular focus on raster data and spatial analysis. When colleagues need to check a feature against recent satellite imagery, they turn to her, usually with one question in mind: has the landscape changed since this was mapped?
Finding usable imagery should not become a project of its own
Before discovering Nimbo, Aline searched for satellite scenes through NASA Earthdata Search. The process could become frustrating: selecting a time window, finding coverage of the right area, then discovering that an otherwise suitable image contained clouds or covered only part of the territory she needed.
She had also tried a cloud-free Sentinel-2 basemap available through a web service in QGIS. Access was easier, but she found the imagery less processed, and she wanted more recent data and more control over which period it showed. An AI assistant suggested Nimbo during that search.
Nimbo provides monthly, largely cloud-free satellite mosaics at 10m resolution, built from Copernicus Sentinel-2 imagery. The data is processed and harmonised before it reaches the user, and it can be accessed directly in GIS software such as QGIS and ArcGIS.
For Aline, this means she no longer has to search through individual scenes and hope one is clear. She picks a month and gets straight to the features she needs to check.
At Mount St. Helens, the right season matters
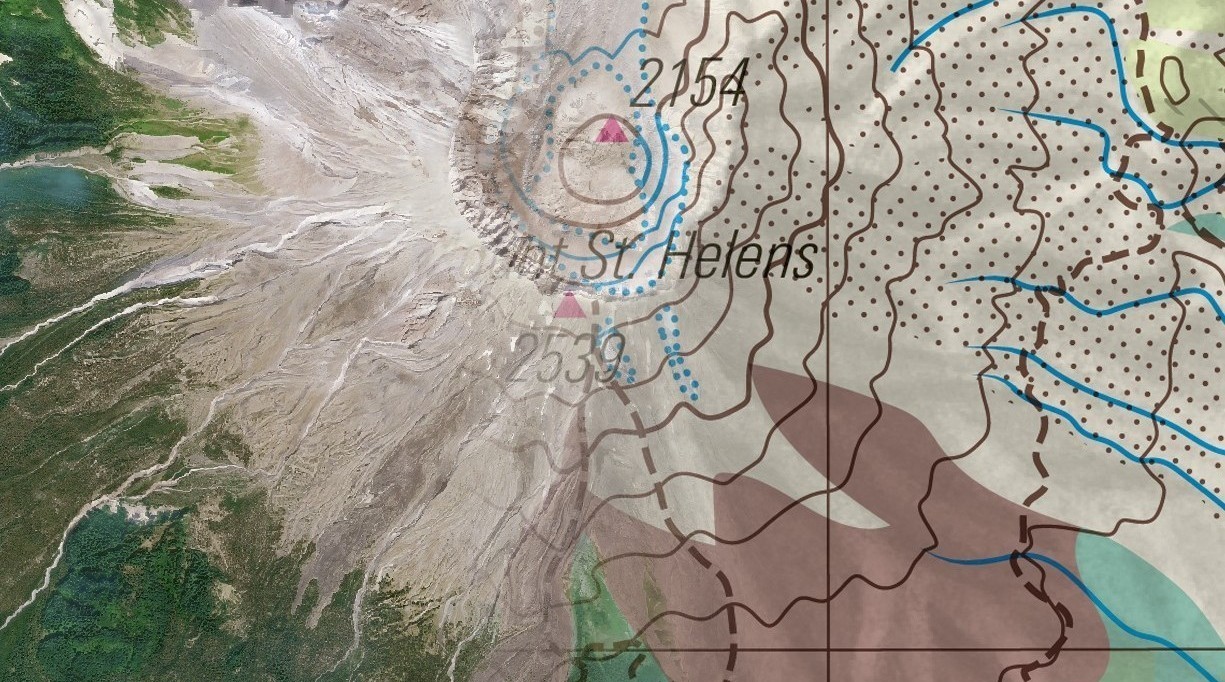
One of the first maps Aline has checked with Nimbo is Mount St. Helens, Washington, USA. The existing map represents conditions in 2018. The team is reviewing several features, including the glacier and the areas shaped by volcanic flows and deposits.
A recent image is useful, but its season matters just as much. Winter snow can hide the features Aline wants to inspect. For this map, she needs a summer image with less snow cover, helping her distinguish the glacier from its surroundings.
“If you take February, everything is white. With Nimbo, we can take June, July or August, and then you can see very clearly.”
Aline Wildberger, Swiss World Atlas editorial team
For this review, she chose August 2026. Having several monthly views available gives her a way to choose imagery according to the feature being mapped, rather than relying on a single fixed image.
Nimbo’s monthly layers are composites rather than single-date photographs. Where observation dates matter, the traceability information can help users assess the age of the underlying imagery.
New imagery, familiar cartographic tools
Nimbo fits into the tools the team already uses. Aline opens the imagery in QGIS through the Nimbo plugin and chooses the month and year she needs. She then uses it as a reference in Adobe Illustrator with MAPublisher, where the atlas maps are produced.
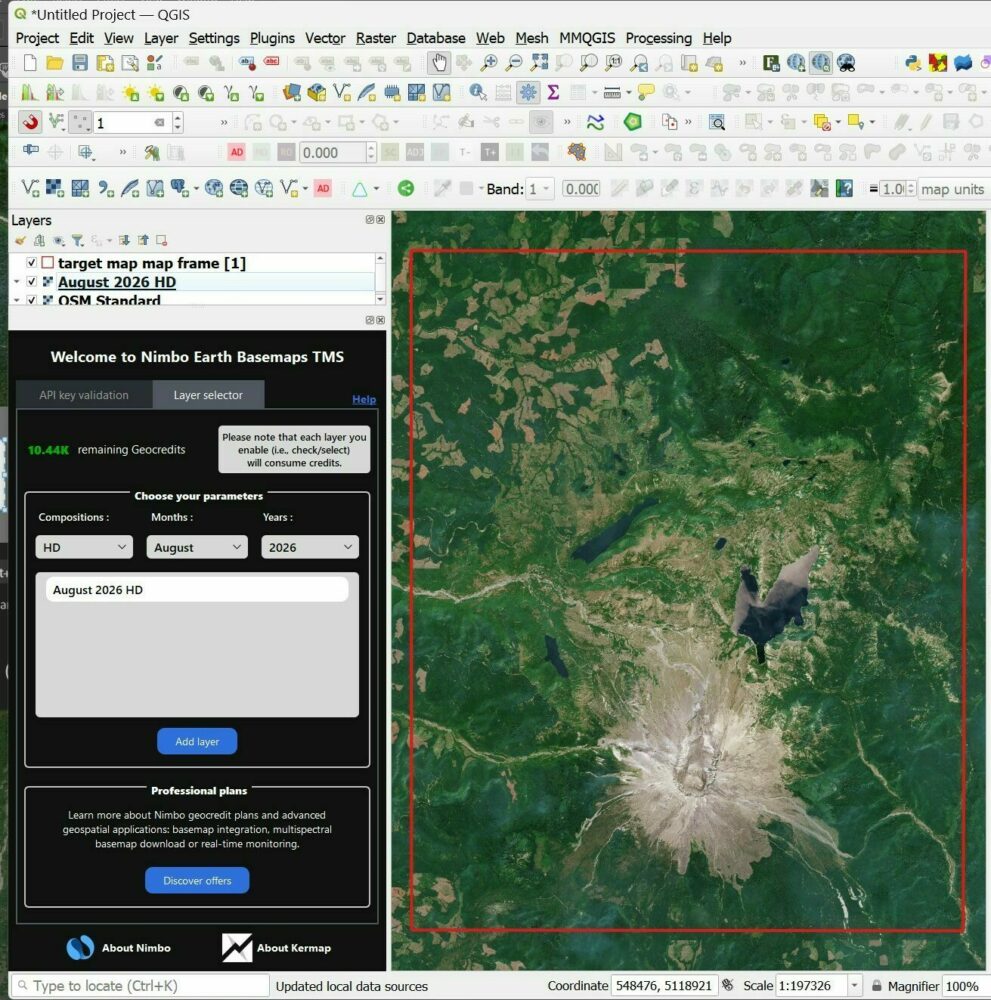
Screenshot: Aline Wildberger
In Illustrator, she can overlay the imagery, adjust its transparency and isolate the outlines she wants to inspect. A glacier boundary, for example, can be examined against the more recent image. Comparing the August 2026 image with the 2018 map, her colleague Martino Beretta from the editorial team redrew the glacier outline and added a lava field that was missing from the map.
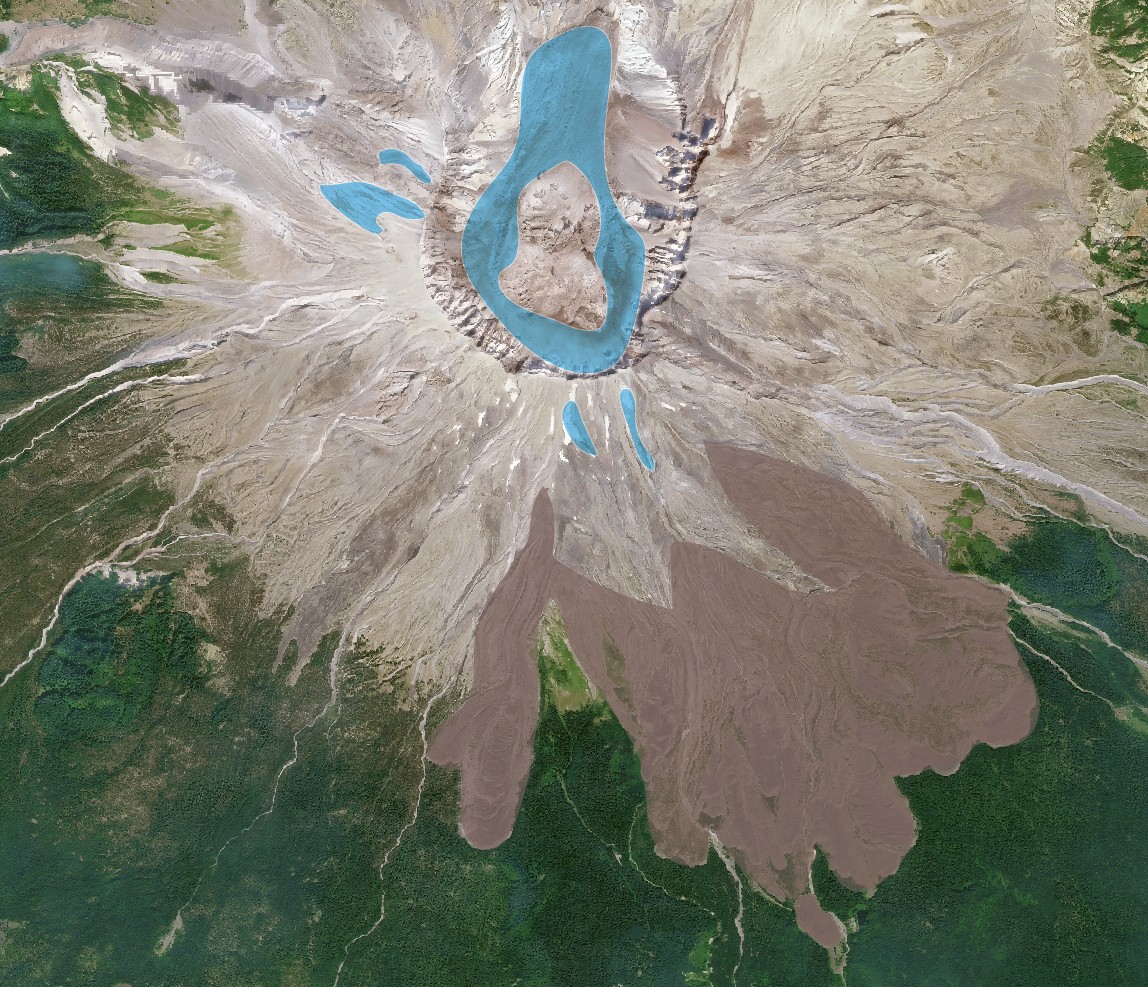
The image gives the cartographers a reliable reference for deciding where further checks or changes may be needed. The map itself remains a designed and generalised representation of the landscape, and every change is made by hand.
Aline first demonstrated the comparison method during our interview in September 2026. The updated glacier outline and the newly added lava field have since been styled to match the rest of the map.
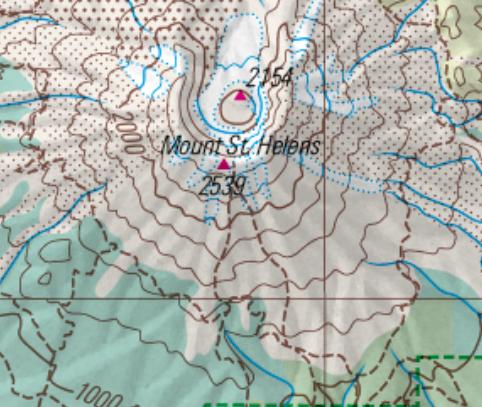
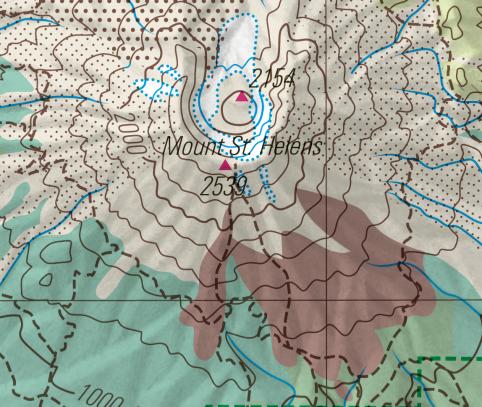
Less effort finding a reference, more attention to the map
When asked what Nimbo changes in her work, Aline points to the ease of finding imagery without clouds, choosing a month and year, and using the result alongside her existing maps.
“If we just need a good reference image, it’s very quick.”
Aline Wildberger, Swiss World Atlas editorial team
Her early experience highlights a specific benefit: simplifying the preparation that comes before the actual map review. The cartographer still interprets the image and decides how to represent what it shows, but obtaining a usable reference becomes more straightforward.
Aline has tested both the standard 10m imagery and Nimbo HD at 2.5m. For Mount St. Helens, she chose the August 2026 HD layer as her reference. She feels the 10m imagery is enough for much of the team’s other work, depending on the feature being mapped.
Nimbo HD is generated each month from Sentinel-2 images using AI-based super-resolution. It adds visual detail, but small features should still be checked before they are mapped.
For this project, the central benefit is therefore not resolution alone. It is the combination of accessible imagery, a relevant season and a reference the team can use in its existing tools.
When to use satellite imagery alongside vector data
Satellite imagery is not needed for every map in the atlas.
Aline explains that, where suitable vector datasets are available, the team can work directly with them. She cites Switzerland as an example of a territory with extensive geographic data.
Imagery becomes particularly useful when the available geometry leaves questions unanswered. A glacier footprint may exist, but its observation date may be unclear. A mapped feature may already have been generalised, making it harder to understand how closely it follows the landscape. Elsewhere, the team may struggle to find suitable vector data for the extent of a settlement or another feature.
In those situations, a recent satellite view provides another source against which to examine the map.
Asked to describe Nimbo’s role in her work, Aline put it this way:
“It’s like looking at places where we can’t be at that moment.”
Aline Wildberger, Swiss World Atlas editorial team
With recent monthly imagery, she can see how a place has changed since it was last mapped, and base the update on firmer ground than an undated outline.
Her colleagues now come to her when other atlas maps need this kind of reference. Mount St. Helens is one of the first maps where the team has used it.
Bringing recent observations into established maps
The Swiss World Atlas shows how satellite imagery can support map revision. With a recent image of the right area, taken in the right season, a cartographer can check whether an existing map still matches the ground. The team’s judgement and tools stay the same: QGIS to access the imagery, Illustrator and MAPublisher to review and revise the map.
For other cartographers and publishers, the easiest place to start is a single map and one feature that needs checking.
Working on a map update? Open Nimbo for your area, pick a month and compare it with the reference you use today.
FAQ
Where can I find recent, cloud-free satellite imagery to check or update a map?
Searching individual scenes in tools like NASA Earthdata Search or USGS EarthExplorer often means sorting through clouds and partial coverage. Nimbo offers up-to-date, largely cloud-free monthly mosaics built from Copernicus Sentinel-2 imagery, ready to use in GIS software such as QGIS and ArcGIS. You choose the area and the month, then compare the image with your existing map to see which features have changed.
Can I choose which month of satellite imagery to use in Nimbo?
Yes. Nimbo provides a separate mosaic for each month, so you can pick the season that suits your map, for example summer imagery to avoid snow cover. Imagery is available for Europe, the Middle East and parts of North Africa from 2019, the USA from 2022, and worldwide from 2023.
How recent is Nimbo imagery?
Each monthly mosaic is published around the middle of the following month.
How can I use Nimbo imagery in QGIS?
Install the Nimbo plugin in QGIS, then choose the month, year and layer you need. The imagery streams directly into your project, so you can view it alongside your existing vector data.
What is the difference between Nimbo’s 10m imagery and Nimbo HD?
The standard layer is a 10m monthly basemap built from Copernicus Sentinel-2 imagery. Nimbo HD is a 2.5m basemap generated each month from Sentinel-2 images using AI-based super-resolution. It shows more visual detail.
Contains modified Copernicus Sentinel data, processed by Nimbo.